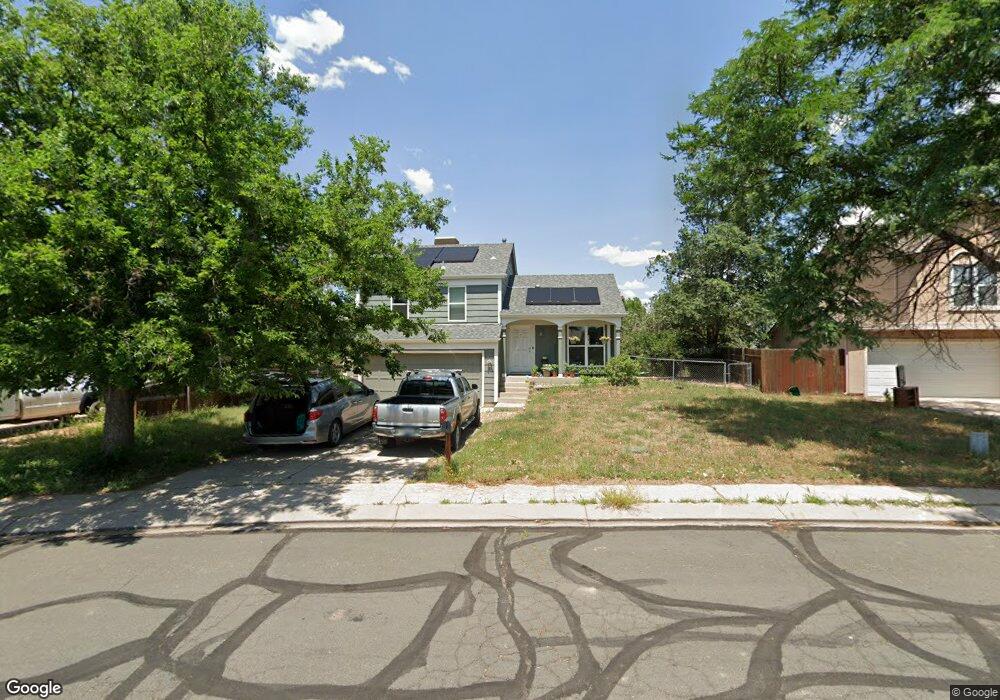
2718 Dickens Dr Colorado Springs, CO 80916
Southborough NeighborhoodEstimated Value: $355,000 - $360,000
3
Beds
1
Bath
1,200
Sq Ft
$298/Sq Ft
Est. Value
About This Home
This home is located at 2718 Dickens Dr, Colorado Springs, CO 80916 and is currently estimated at $357,784, approximately $298 per square foot. 2718 Dickens Dr is a home located in El Paso County with nearby schools including Giberson Elementary School, Panorama Middle School, and Sierra High School.
Ownership History
Date
Name
Owned For
Owner Type
Purchase Details
Closed on
Mar 26, 2021
Sold by
Trulley Ananda
Bought by
Repsold David and Repsold Olivia
Current Estimated Value
Home Financials for this Owner
Home Financials are based on the most recent Mortgage that was taken out on this home.
Original Mortgage
$275,808
Outstanding Balance
$247,927
Interest Rate
2.73%
Mortgage Type
VA
Estimated Equity
$109,857
Purchase Details
Closed on
May 4, 2018
Bought by
Trulley Ananda
Home Financials for this Owner
Home Financials are based on the most recent Mortgage that was taken out on this home.
Original Mortgage
$215,536
Interest Rate
4.55%
Purchase Details
Closed on
Mar 19, 2014
Sold by
Cho Sukhee Andrew
Bought by
Jubi Capital
Purchase Details
Closed on
Nov 6, 2013
Sold by
Ho Investments Llc
Bought by
Cho Sukhee Andrew
Home Financials for this Owner
Home Financials are based on the most recent Mortgage that was taken out on this home.
Original Mortgage
$118,500
Interest Rate
4.28%
Mortgage Type
New Conventional
Purchase Details
Closed on
Jun 19, 2013
Sold by
Pnc Bank National Association
Bought by
Ho Investments Llc
Purchase Details
Closed on
Jul 3, 2012
Sold by
Johnson Michael T and Johnson Antoinette S
Bought by
Pnc Bank National Association
Purchase Details
Closed on
Jun 26, 2012
Sold by
Secretary Of Veterans Affairs
Bought by
Pnc Bank National Association
Purchase Details
Closed on
Apr 28, 2004
Sold by
Douglass Jeffrey H and Douglass Aliesha
Bought by
Johnson Michael T and Johnson Antoinette S
Home Financials for this Owner
Home Financials are based on the most recent Mortgage that was taken out on this home.
Original Mortgage
$132,500
Interest Rate
4.5%
Mortgage Type
VA
Purchase Details
Closed on
Feb 8, 1996
Sold by
Jones Jeffrey R
Bought by
Douglass Jeffrey H and Douglass Aliesha
Home Financials for this Owner
Home Financials are based on the most recent Mortgage that was taken out on this home.
Original Mortgage
$91,789
Interest Rate
7.08%
Mortgage Type
VA
Purchase Details
Closed on
Apr 12, 1994
Sold by
Diercouff Kenneth J and Diercouff Monica J
Bought by
Jones Jeffrey R
Home Financials for this Owner
Home Financials are based on the most recent Mortgage that was taken out on this home.
Original Mortgage
$78,450
Interest Rate
8%
Mortgage Type
VA
Purchase Details
Closed on
Mar 1, 1983
Bought by
Jubi Capital
Create a Home Valuation Report for This Property
The Home Valuation Report is an in-depth analysis detailing your home's value as well as a comparison with similar homes in the area
Home Values in the Area
Average Home Value in this Area
Purchase History
| Date | Buyer | Sale Price | Title Company |
|---|---|---|---|
| Repsold David | $340,000 | Empire Title Co Springs Llc | |
| Trulley Ananda | $211,000 | -- | |
| Jubi Capital | -- | None Available | |
| Jubi Capital | -- | None Available | |
| Cho Sukhee Andrew | $158,000 | Fidelity National Title Insu | |
| Ho Investments Llc | $100,100 | None Available | |
| Pnc Bank National Association | -- | None Available | |
| Pnc Bank National Association | -- | None Available | |
| Secretary Of Veterans Affairs | -- | None Available | |
| Johnson Michael T | $132,500 | Fahtco | |
| Douglass Jeffrey H | $89,990 | First American Title | |
| Jones Jeffrey R | $76,950 | First American Title | |
| Jubi Capital | -- | -- |
Source: Public Records
Mortgage History
| Date | Status | Borrower | Loan Amount |
|---|---|---|---|
| Open | Repsold David | $275,808 | |
| Previous Owner | Trulley Ananda | $215,536 | |
| Previous Owner | Trulley Ananda | -- | |
| Previous Owner | Cho Sukhee Andrew | $118,500 | |
| Previous Owner | Johnson Michael T | $132,500 | |
| Previous Owner | Douglass Jeffrey H | $91,789 | |
| Previous Owner | Jones Jeffrey R | $78,450 |
Source: Public Records
Tax History Compared to Growth
Tax History
| Year | Tax Paid | Tax Assessment Tax Assessment Total Assessment is a certain percentage of the fair market value that is determined by local assessors to be the total taxable value of land and additions on the property. | Land | Improvement |
|---|---|---|---|---|
| 2025 | $1,110 | $22,850 | -- | -- |
| 2024 | $854 | $22,940 | $3,580 | $19,360 |
| 2023 | $854 | $22,940 | $3,580 | $19,360 |
| 2022 | $884 | $16,390 | $3,130 | $13,260 |
| 2021 | $944 | $16,870 | $3,220 | $13,650 |
| 2020 | $960 | $14,740 | $2,500 | $12,240 |
| 2019 | $931 | $14,740 | $2,500 | $12,240 |
| 2018 | $665 | $10,130 | $1,800 | $8,330 |
| 2017 | $508 | $10,130 | $1,800 | $8,330 |
| 2016 | $595 | $11,140 | $1,830 | $9,310 |
| 2015 | $594 | $11,140 | $1,830 | $9,310 |
| 2014 | $483 | $8,950 | $1,830 | $7,120 |
Source: Public Records
Map
Nearby Homes
- 2535 Helton Ct
- 2742 Dickens Dr
- 2625 Plymouth Dr
- 2655 Prescott Cir E
- 4952 Joseph Dr
- 2922 Dickens Dr
- 2785 Clarendon Dr
- 4754 Painted Sky View
- 4770 Newton Dr
- 5089 Eldon Dr S Unit 20
- 4806 Rusty Nail Point Unit 202
- 4598 Wordsworth Cir N
- 5054 Rusty Nail Point
- 4731 Astrozon Blvd
- 4520 Melville Dr
- 3059 Shikra View
- 2467 Lexington Village Ln Unit G3
- 2522 Astrozon Cir
- 4530 London Ln
- 4820 Sea Eagle Dr
- 2734 Dickens Dr
- 2545 Helton Ct
- 2525 Helton Ct
- 2717 Dickens Dr
- 2555 Helton Ct
- 2702 Dickens Dr
- 2725 Dickens Dr
- 2615 Helton Ct
- 2515 Helton Ct
- 2625 Helton Ct
- 2731 Dickens Dr
- 2655 Plymouth Dr
- 2520 Helton Ct
- 2743 Dickens Dr
- 2530 Helton Ct
- 2645 Plymouth Dr
- 4907 Joseph Dr
- 2670 Plymouth Dr
- 2802 Dickens Dr
- 2735 Dickens Dr