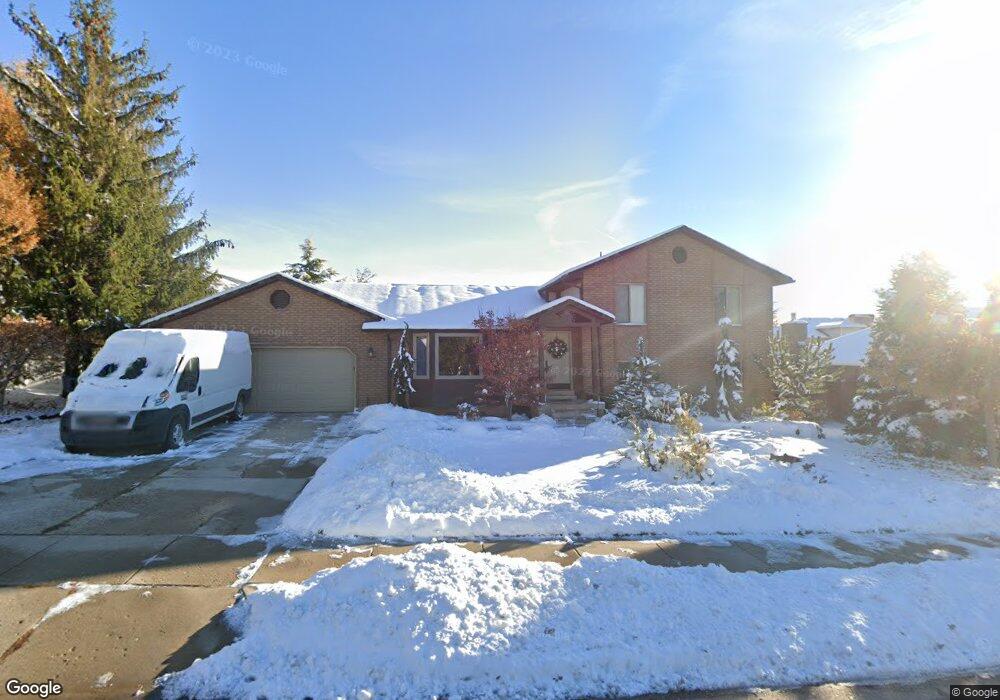
2718 E 1650 N Layton, UT 84040
Estimated Value: $595,000 - $659,000
5
Beds
3
Baths
2,764
Sq Ft
$226/Sq Ft
Est. Value
About This Home
This home is located at 2718 E 1650 N, Layton, UT 84040 and is currently estimated at $623,639, approximately $225 per square foot. 2718 E 1650 N is a home located in Davis County with nearby schools including East Layton Elementary School, Central Davis Junior High School, and Northridge High School.
Ownership History
Date
Name
Owned For
Owner Type
Purchase Details
Closed on
Jan 16, 2024
Sold by
Useche Hector Daniel
Bought by
Haver Heather Kelly and Haver Jesse
Current Estimated Value
Home Financials for this Owner
Home Financials are based on the most recent Mortgage that was taken out on this home.
Original Mortgage
$444,500
Outstanding Balance
$436,431
Interest Rate
7.03%
Mortgage Type
New Conventional
Estimated Equity
$187,208
Purchase Details
Closed on
Mar 29, 2016
Sold by
Sullivan Sullivan D and Sullivan Mary
Bought by
Uesche Hector Daniel
Purchase Details
Closed on
Jul 30, 2008
Sold by
Sachse Thomas H and Sachse Cheryl J
Bought by
Sullivan D Alex and Sullivan Mary
Home Financials for this Owner
Home Financials are based on the most recent Mortgage that was taken out on this home.
Original Mortgage
$6,945
Interest Rate
6.41%
Mortgage Type
Stand Alone Second
Create a Home Valuation Report for This Property
The Home Valuation Report is an in-depth analysis detailing your home's value as well as a comparison with similar homes in the area
Home Values in the Area
Average Home Value in this Area
Purchase History
| Date | Buyer | Sale Price | Title Company |
|---|---|---|---|
| Haver Heather Kelly | -- | Gt Title Services | |
| Uesche Hector Daniel | -- | Backman Title | |
| Sullivan D Alex | -- | Executive Title Ins Agency |
Source: Public Records
Mortgage History
| Date | Status | Borrower | Loan Amount |
|---|---|---|---|
| Open | Haver Heather Kelly | $444,500 | |
| Previous Owner | Sullivan D Alex | $6,945 | |
| Previous Owner | Sullivan D Alex | $224,555 |
Source: Public Records
Tax History
| Year | Tax Paid | Tax Assessment Tax Assessment Total Assessment is a certain percentage of the fair market value that is determined by local assessors to be the total taxable value of land and additions on the property. | Land | Improvement |
|---|---|---|---|---|
| 2025 | $3,092 | $324,500 | $123,792 | $200,708 |
| 2024 | $2,949 | $311,850 | $147,746 | $164,104 |
| 2023 | $2,849 | $531,000 | $199,490 | $331,510 |
| 2022 | $3,005 | $304,150 | $106,981 | $197,169 |
| 2021 | $2,902 | $438,000 | $162,775 | $275,225 |
| 2020 | $2,631 | $381,000 | $131,643 | $249,357 |
| 2019 | $2,517 | $357,000 | $117,631 | $239,369 |
| 2018 | $2,325 | $331,000 | $91,447 | $239,553 |
| 2016 | $1,924 | $141,295 | $63,577 | $77,718 |
| 2015 | $1,966 | $137,115 | $63,577 | $73,538 |
| 2014 | $1,690 | $120,527 | $63,577 | $56,950 |
| 2013 | -- | $116,261 | $34,135 | $82,126 |
Source: Public Records
Map
Nearby Homes
- 1752 N Valley View Dr
- 2231 N Valley View Dr
- 1870 N Valley View Dr Unit 201
- 2547 E 1900 N
- 1954 N 2600 E
- 2509 E 1900 N
- 2391 Kays Creek Dr
- 1332 N 2350 E
- 2136 N 2800 E
- 1907 N Bridge Ct
- 2563 E 2250 N
- 2855 E Gentile St Unit 1
- 2124 E Cherry Ln
- 2203 E 1200 N
- 1975 E 1425 N
- 2113 E 1200 N
- 1843 Hayes Dr
- 2569 N 2900 E
- 2340 N 2050 E
- 2273 N 1975 E
Your Personal Tour Guide
Ask me questions while you tour the home.