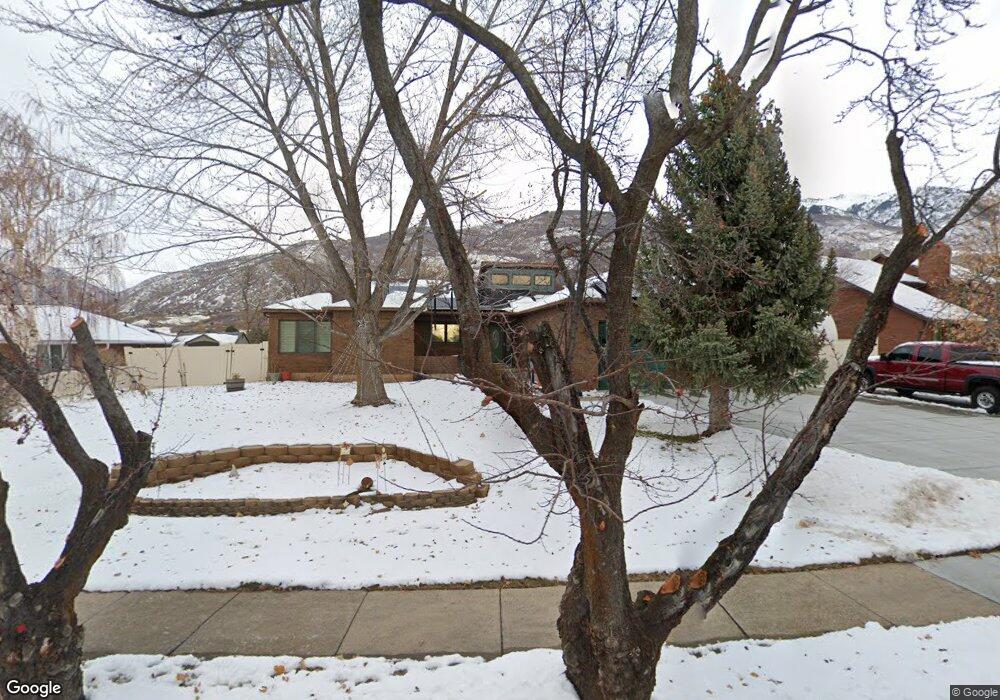
2718 N 2600 E Layton, UT 84040
Estimated Value: $562,000 - $646,000
3
Beds
3
Baths
3,420
Sq Ft
$179/Sq Ft
Est. Value
About This Home
This home is located at 2718 N 2600 E, Layton, UT 84040 and is currently estimated at $612,272, approximately $179 per square foot. 2718 N 2600 E is a home located in Davis County with nearby schools including Sarah Jane Adams Elementary School, North Layton Junior High School, and Northridge High School.
Ownership History
Date
Name
Owned For
Owner Type
Purchase Details
Closed on
Jun 7, 2022
Sold by
Flood Stuart W
Bought by
Potter Julianna and Miller Chad
Current Estimated Value
Home Financials for this Owner
Home Financials are based on the most recent Mortgage that was taken out on this home.
Original Mortgage
$375,000
Outstanding Balance
$355,727
Interest Rate
5.09%
Mortgage Type
New Conventional
Estimated Equity
$256,545
Purchase Details
Closed on
Jul 20, 1998
Sold by
Flood Stuart W and Plecker Flood Susan K
Bought by
Flood Stuart W
Purchase Details
Closed on
Jul 15, 1998
Sold by
Flood Stuart W
Bought by
Flood Stuart W and Plecker Flood Susan K
Purchase Details
Closed on
Jun 25, 1997
Sold by
Arnold Ronald T and Arnold Suzanne J
Bought by
Close Michael H and Kathy Close S
Home Financials for this Owner
Home Financials are based on the most recent Mortgage that was taken out on this home.
Original Mortgage
$195,750
Interest Rate
5.95%
Create a Home Valuation Report for This Property
The Home Valuation Report is an in-depth analysis detailing your home's value as well as a comparison with similar homes in the area
Home Values in the Area
Average Home Value in this Area
Purchase History
| Date | Buyer | Sale Price | Title Company |
|---|---|---|---|
| Potter Julianna | -- | None Listed On Document | |
| Flood Stuart W | -- | Associated Title Company | |
| Flood Stuart W | -- | Associated Title Company | |
| Flood Stuart W | -- | Home Abst & Title Co | |
| Close Michael H | -- | Associated Title Company |
Source: Public Records
Mortgage History
| Date | Status | Borrower | Loan Amount |
|---|---|---|---|
| Open | Potter Julianna | $375,000 | |
| Previous Owner | Close Michael H | $195,750 |
Source: Public Records
Tax History
| Year | Tax Paid | Tax Assessment Tax Assessment Total Assessment is a certain percentage of the fair market value that is determined by local assessors to be the total taxable value of land and additions on the property. | Land | Improvement |
|---|---|---|---|---|
| 2025 | $3,303 | $316,800 | $120,120 | $196,680 |
| 2024 | $3,134 | $305,250 | $132,497 | $172,753 |
| 2023 | $3,163 | $550,000 | $168,270 | $381,730 |
| 2022 | $3,269 | $310,750 | $91,149 | $219,601 |
| 2021 | $2,991 | $423,000 | $186,876 | $236,124 |
| 2020 | $2,727 | $369,000 | $159,156 | $209,844 |
| 2019 | $2,655 | $354,000 | $140,449 | $213,551 |
| 2018 | $2,459 | $329,000 | $115,670 | $213,330 |
| 2016 | $2,252 | $158,235 | $59,535 | $98,700 |
| 2015 | $2,208 | $148,335 | $59,535 | $88,800 |
| 2014 | $2,050 | $141,597 | $59,535 | $82,062 |
| 2013 | -- | $140,807 | $36,744 | $104,063 |
Source: Public Records
Map
Nearby Homes
- 2597 N 2300 E
- 2569 N 2900 E
- 2353 Canyon View Dr
- 2563 E 2250 N
- 2136 N 2800 E
- 1935 Deere Valley Dr
- 2340 N 2050 E
- 1911 Deere Valley Dr
- 3297 N Layton Ridge Dr
- 3232 N Redtail Way
- 1954 N 2600 E
- 2273 N 1975 E
- 2547 E 1900 N
- 2509 E 1900 N
- 1821 E Whitetail Way
- 1785 E 2825 N
- 1827 E Whitetail Dr
- 1731 E 2825 N
- 1960 N 2150 E
- 2189 N 1950 E
Your Personal Tour Guide
Ask me questions while you tour the home.