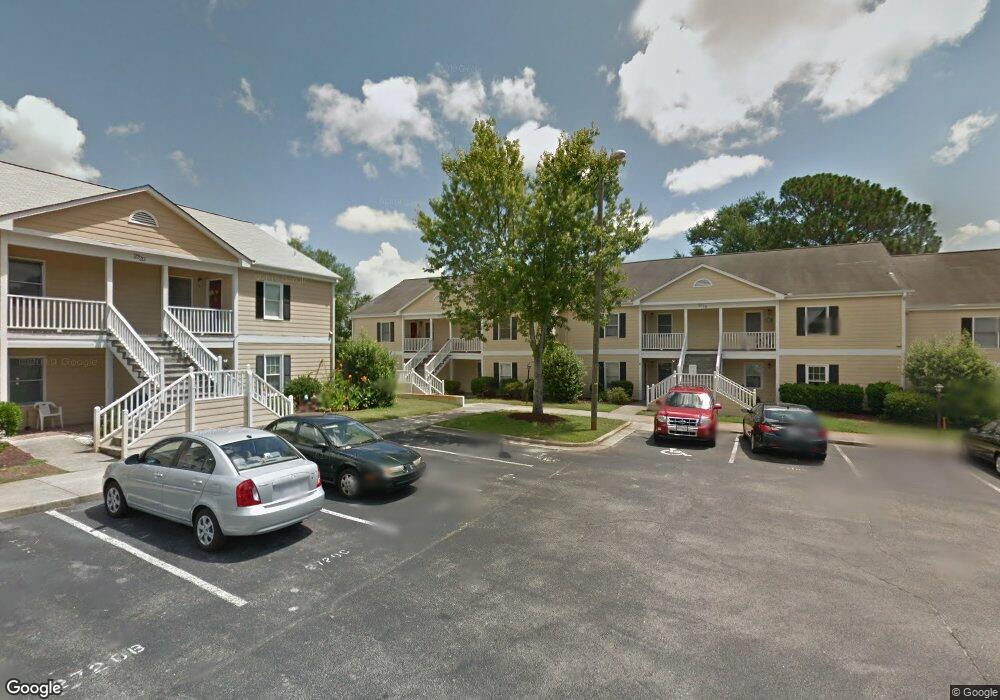
2718 S 17th St Unit B Wilmington, NC 28412
Barclay West-Hanover Heights NeighborhoodEstimated Value: $176,328 - $289,000
2
Beds
2
Baths
918
Sq Ft
$226/Sq Ft
Est. Value
About This Home
This home is located at 2718 S 17th St Unit B, Wilmington, NC 28412 and is currently estimated at $207,582, approximately $226 per square foot. 2718 S 17th St Unit B is a home located in New Hanover County with nearby schools including Edwin A. Alderman Elementary School, Williston Middle School, and Eugene Ashley High School.
Ownership History
Date
Name
Owned For
Owner Type
Purchase Details
Closed on
Mar 2, 2012
Sold by
Federal Home Loan Mortgage Corporation
Bought by
Menker Harmon R and Menker Dolores C
Current Estimated Value
Purchase Details
Closed on
Jan 31, 2012
Sold by
Crawford James Bradley
Bought by
Federal Home Loan Mortgage Corporation
Purchase Details
Closed on
May 3, 2007
Sold by
Fell Jessica Mann and Estate Of Roberta Dubpernell K
Bought by
Crawford James Bradley
Home Financials for this Owner
Home Financials are based on the most recent Mortgage that was taken out on this home.
Original Mortgage
$104,400
Interest Rate
6.12%
Mortgage Type
Purchase Money Mortgage
Purchase Details
Closed on
Dec 22, 2004
Sold by
Cobblestone Apartments Inc
Bought by
Kelsh Roberta D
Purchase Details
Closed on
Dec 26, 1990
Sold by
Providence Investors
Bought by
Cobblestone Apartments Inc
Create a Home Valuation Report for This Property
The Home Valuation Report is an in-depth analysis detailing your home's value as well as a comparison with similar homes in the area
Home Values in the Area
Average Home Value in this Area
Purchase History
| Date | Buyer | Sale Price | Title Company |
|---|---|---|---|
| Menker Harmon R | -- | None Available | |
| Federal Home Loan Mortgage Corporation | $73,000 | None Available | |
| Crawford James Bradley | $110,000 | None Available | |
| Kelsh Roberta D | $68,500 | -- | |
| Cobblestone Apartments Inc | $287,500 | -- |
Source: Public Records
Mortgage History
| Date | Status | Borrower | Loan Amount |
|---|---|---|---|
| Previous Owner | Crawford James Bradley | $104,400 |
Source: Public Records
Tax History Compared to Growth
Tax History
| Year | Tax Paid | Tax Assessment Tax Assessment Total Assessment is a certain percentage of the fair market value that is determined by local assessors to be the total taxable value of land and additions on the property. | Land | Improvement |
|---|---|---|---|---|
| 2025 | $772 | $182,200 | $0 | $182,200 |
| 2023 | $772 | $118,300 | $0 | $118,300 |
| 2022 | $1,006 | $118,300 | $0 | $118,300 |
| 2021 | $1,012 | $118,300 | $0 | $118,300 |
| 2020 | $885 | $84,000 | $0 | $84,000 |
| 2019 | $885 | $84,000 | $0 | $84,000 |
| 2018 | $885 | $84,000 | $0 | $84,000 |
| 2017 | $885 | $84,000 | $0 | $84,000 |
| 2016 | $896 | $80,900 | $0 | $80,900 |
| 2015 | $857 | $80,900 | $0 | $80,900 |
| 2014 | $820 | $80,900 | $0 | $80,900 |
Source: Public Records
Map
Nearby Homes
- 2720 S 17th St Unit D
- 2716 S 17th St Unit A
- 2713 Newkirk Ave
- 1505 Cadfel Ct Unit 203
- 2807 Bloomfield Ln Unit 206
- 2820 Bloomfield Ln Unit 207
- 1500 Cadfel Ct Unit 202
- 1017 Parkway Blvd
- 1102 Adelaide Dr
- 1234 Shipyard Blvd
- 6535 Shark Tooth Trail
- 2507 Flint Dr
- 806 Midland Dr
- 2207 Drawing Ct
- 2208 Drawing Ct
- 1299 Wellington Ave
- 196 Foundry Dr
- 2302 Foundry Ct
- 410 Jeb Stuart Dr
- 3743 Reston Ct
- 2730 S 17th St Unit C
- 2730 S 17th St Unit B
- 2726 S 17th St Unit C
- 2726 S 17th St Unit 2726a
- 2728 S 17th St Unit 2728c
- 2728 S 17th St Unit A
- 2728 S 17th St Unit C
- 2730 S 17th St
- 2726 S 17th St
- 2728 S 17th St Unit B
- 2730 S 17th St Unit D
- 2730 S 17th St
- 2726 S 17th St
- 2726 S 17th St
- 2718 S 17th St Unit C
- 2722 S 17th St Unit D
- 2718 S 17th St Unit D
- 2722 S 17th St Unit B
- 2722 S 17th St Unit A
- 2718 S 17th St Unit A