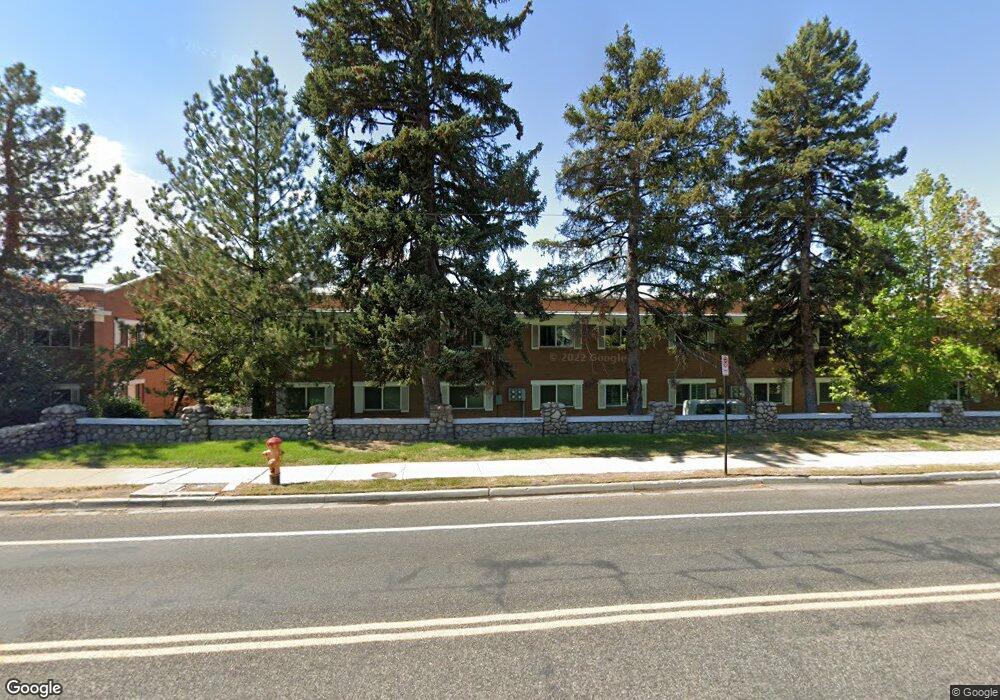
2718 S Highland Dr Unit 2 Salt Lake City, UT 84106
Sugar House NeighborhoodEstimated Value: $379,501 - $478,000
2
Beds
2
Baths
1,659
Sq Ft
$260/Sq Ft
Est. Value
About This Home
This home is located at 2718 S Highland Dr Unit 2, Salt Lake City, UT 84106 and is currently estimated at $430,625, approximately $259 per square foot. 2718 S Highland Dr Unit 2 is a home located in Salt Lake County with nearby schools including Nibley Park School, Highland High School, and Carden Memorial School.
Ownership History
Date
Name
Owned For
Owner Type
Purchase Details
Closed on
Jul 28, 2022
Sold by
Bennion Sydney B and Bennion Robert S
Bought by
Bennion Living Trust
Current Estimated Value
Purchase Details
Closed on
Oct 4, 2016
Sold by
Lavin Arthur G
Bought by
Bennon Sydney B and Bennon Robert S
Home Financials for this Owner
Home Financials are based on the most recent Mortgage that was taken out on this home.
Original Mortgage
$148,140
Interest Rate
3.44%
Mortgage Type
New Conventional
Purchase Details
Closed on
Mar 2, 2016
Sold by
Brown Thomas G
Bought by
Lavin Arthur G
Purchase Details
Closed on
May 30, 1997
Sold by
Coll Kathryn J
Bought by
Brown Thomas G and Brown Catherine M
Home Financials for this Owner
Home Financials are based on the most recent Mortgage that was taken out on this home.
Original Mortgage
$92,500
Interest Rate
8.08%
Mortgage Type
Balloon
Create a Home Valuation Report for This Property
The Home Valuation Report is an in-depth analysis detailing your home's value as well as a comparison with similar homes in the area
Home Values in the Area
Average Home Value in this Area
Purchase History
| Date | Buyer | Sale Price | Title Company |
|---|---|---|---|
| Bennion Living Trust | -- | None Listed On Document | |
| Bennon Sydney B | -- | Landmark Title | |
| Lavin Arthur G | -- | Integrated Title Ins Service | |
| Brown Thomas G | -- | Paramount Title Corp |
Source: Public Records
Mortgage History
| Date | Status | Borrower | Loan Amount |
|---|---|---|---|
| Previous Owner | Bennon Sydney B | $148,140 | |
| Previous Owner | Brown Thomas G | $92,500 |
Source: Public Records
Tax History Compared to Growth
Tax History
| Year | Tax Paid | Tax Assessment Tax Assessment Total Assessment is a certain percentage of the fair market value that is determined by local assessors to be the total taxable value of land and additions on the property. | Land | Improvement |
|---|---|---|---|---|
| 2025 | $1,877 | $351,000 | $105,300 | $245,700 |
| 2024 | $1,877 | $358,200 | $107,400 | $250,800 |
| 2023 | $1,861 | $342,300 | $102,700 | $239,600 |
| 2022 | $1,971 | $340,100 | $102,000 | $238,100 |
| 2021 | $1,695 | $264,800 | $79,400 | $185,400 |
| 2020 | $1,671 | $248,500 | $74,500 | $174,000 |
| 2019 | $1,721 | $240,800 | $72,200 | $168,600 |
| 2018 | $0 | $218,700 | $65,600 | $153,100 |
| 2017 | $1,518 | $193,800 | $58,100 | $135,700 |
| 2016 | $1,360 | $164,800 | $49,400 | $115,400 |
| 2015 | $1,366 | $156,900 | $47,100 | $109,800 |
| 2014 | $1,363 | $155,300 | $46,600 | $108,700 |
Source: Public Records
Map
Nearby Homes
- 2710 S Highland Dr Unit 11
- 1190 E 2700 S Unit A4
- 1190 E 2700 S Unit A1
- 1192 E 2700 S
- 2760 S Highland Dr Unit 21
- 1130 E 2700 S Unit K83
- 1150 E 2700 S Unit 50G
- 1150 E 2700 S Unit G51
- 1152 E 2700 S Unit S148
- 2618 S 1100 E
- 1314 E Crandall Ave
- 2865 S 1335 E
- 2430 S Elizabeth St Unit 5
- 2438 S Elizabeth St Unit 2
- 2477 S Douglas St
- 1168 E Parkway Ave
- 1371 E Zenith Ave
- 2970 S Richmond St
- 2400 S Elizabeth St Unit 4
- 916 E Forest View Ave
- 2718 S Highland Dr
- 2718 S Highland Dr Unit I
- 2718 S Highland Dr Unit 5
- 2718 S Highland Dr Unit 3
- 2718 S Highland Dr Unit 9
- 2718 S Highland Dr Unit 5
- 2718 S Highland Dr Unit 1
- 2718 S Highland Dr Unit 1
- 2718 S Highland Dr Unit 10
- 2718 S Highland Dr Unit 8
- 2718 S Highland Dr Unit 11
- 2718 S Highland Dr Unit 9
- 2718 S Highland Dr Unit 7
- 2728 Highland Dr Unit 5
- 2728 Highland Dr Unit 9
- 2728 Highland Dr Unit 8
- 2728 Highland Dr Unit 12
- 2728 Highland Dr Unit 11
- 2728 Highland Dr Unit 2
- 2728 Highland Dr Unit 7