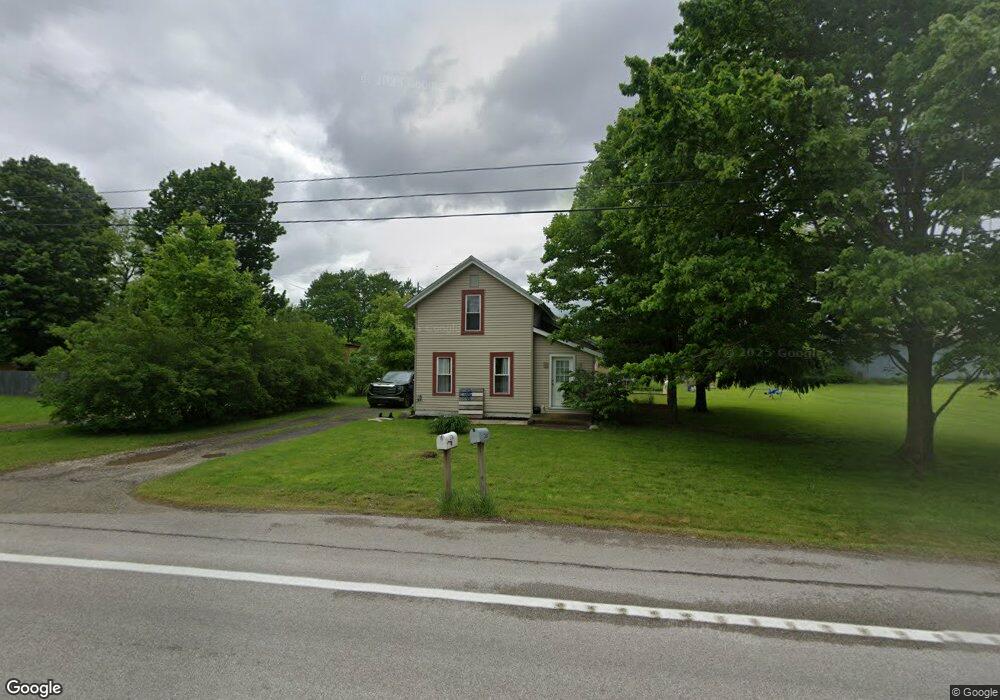
2718 State Route 7 Andover, OH 44003
Estimated Value: $83,228 - $112,000
3
Beds
1
Bath
888
Sq Ft
$110/Sq Ft
Est. Value
About This Home
This home is located at 2718 State Route 7, Andover, OH 44003 and is currently estimated at $97,307, approximately $109 per square foot. 2718 State Route 7 is a home located in Ashtabula County with nearby schools including Pymatuning Valley Primary School, Pymatuning Valley Middle School, and Pymatuning Valley High School.
Ownership History
Date
Name
Owned For
Owner Type
Purchase Details
Closed on
Dec 10, 2019
Sold by
Root Julie L and Nationstar Mortgage Llc
Bought by
Hitchcock Gordon M and Hitchcock Jodie L
Current Estimated Value
Purchase Details
Closed on
Mar 21, 2005
Sold by
Root Jason A and Root Danielle R
Bought by
Root Aaron and Root Julie L
Home Financials for this Owner
Home Financials are based on the most recent Mortgage that was taken out on this home.
Original Mortgage
$51,900
Interest Rate
5.61%
Mortgage Type
Fannie Mae Freddie Mac
Purchase Details
Closed on
Jan 29, 2001
Sold by
Keybank Na
Bought by
Root Jason and Root Danielle
Purchase Details
Closed on
Nov 3, 1999
Sold by
Moisio Charles D
Bought by
Keybank National Assoc
Create a Home Valuation Report for This Property
The Home Valuation Report is an in-depth analysis detailing your home's value as well as a comparison with similar homes in the area
Home Values in the Area
Average Home Value in this Area
Purchase History
| Date | Buyer | Sale Price | Title Company |
|---|---|---|---|
| Hitchcock Gordon M | $12,000 | Nova Title Agency Inc | |
| Root Aaron | -- | -- | |
| Root Jason | $25,000 | -- | |
| Keybank National Assoc | $34,000 | -- |
Source: Public Records
Mortgage History
| Date | Status | Borrower | Loan Amount |
|---|---|---|---|
| Previous Owner | Root Aaron | $51,900 |
Source: Public Records
Tax History Compared to Growth
Tax History
| Year | Tax Paid | Tax Assessment Tax Assessment Total Assessment is a certain percentage of the fair market value that is determined by local assessors to be the total taxable value of land and additions on the property. | Land | Improvement |
|---|---|---|---|---|
| 2024 | $892 | $16,910 | $2,870 | $14,040 |
| 2023 | $673 | $16,910 | $2,870 | $14,040 |
| 2022 | $508 | $12,260 | $2,210 | $10,050 |
| 2021 | $532 | $12,260 | $2,210 | $10,050 |
| 2020 | $533 | $12,260 | $2,210 | $10,050 |
| 2019 | $692 | $15,440 | $2,350 | $13,090 |
| 2018 | $669 | $15,440 | $2,350 | $13,090 |
| 2017 | $661 | $15,440 | $2,350 | $13,090 |
| 2016 | $659 | $15,330 | $2,310 | $13,020 |
| 2015 | $662 | $15,330 | $2,310 | $13,020 |
| 2014 | $631 | $15,330 | $2,310 | $13,020 |
| 2013 | $488 | $11,280 | $1,230 | $10,050 |
Source: Public Records
Map
Nearby Homes
- 6590 Hall Rd
- 6174 US Route 6
- 2393 Stanhope Kelloggsville Rd
- 0 Schaen Dr Unit 5167318
- 5719 N Richmond Rd
- 0 Stanhope-Kelloggsville Rd
- 3+ /- Acres on Phelps Rd
- 17315 Phelps Rd
- 4546 Pymatuning Lake Rd
- 4594 Center Rd
- 5378 Owen Hill Rd
- 2109 U S 6
- 0 B and B Dr
- 4974 N Main St
- 0 Tower Rd
- 0 Lakeview Rd
- 350 Ohio 7
- 0 Maple Ave
- 185 Maple Ave
- 5000 Pymatuning Lake Rd
- 2734 State Route 7
- 2748 State Route 7
- 2747 State Route 7
- 2721 State Route 7
- 2700 State Route 7
- 2688 State Route 7
- 2691 Ohio 7
- 2731 State Route 7
- 2731 State Route 7 Usr 6
- 2661 Ohio 7
- 2647 State Route 7
- 2646 State Route 7
- 2641 State Route 7 Unit 6
- 2641 State Route 7 Usr 6
- 5920 Footville Richmond Rd
- 2800 State Route 7
- 5921 Footville Richmond Rd
- 2799 State Route 7
- 5878 Footville Richmond Rd
- 6 State Rd