2719 Lancaster-Kirkersville Rd NW Lancaster, OH 43130
Estimated Value: $913,175 - $1,076,000
4
Beds
5
Baths
6,800
Sq Ft
$143/Sq Ft
Est. Value
About This Home
This home is located at 2719 Lancaster-Kirkersville Rd NW, Lancaster, OH 43130 and is currently estimated at $974,392, approximately $143 per square foot. 2719 Lancaster-Kirkersville Rd NW is a home located in Fairfield County with nearby schools including Bloom Carroll Primary School, Bloom Carroll Intermediate School, and Bloom-Carroll Middle School.
Ownership History
Date
Name
Owned For
Owner Type
Purchase Details
Closed on
Jul 13, 2010
Sold by
Happeny Larry
Bought by
Happeny Cristi
Current Estimated Value
Purchase Details
Closed on
Feb 20, 2007
Sold by
Happeny Cristi and Happeny Larry
Bought by
Happeny Larry and Happeny Cristi
Purchase Details
Closed on
Jun 23, 2004
Sold by
Motsch Jennifer L
Bought by
Happeny Cristi
Home Financials for this Owner
Home Financials are based on the most recent Mortgage that was taken out on this home.
Original Mortgage
$392,000
Outstanding Balance
$216,580
Interest Rate
7.99%
Mortgage Type
Purchase Money Mortgage
Estimated Equity
$757,812
Purchase Details
Closed on
Nov 20, 1998
Sold by
Jones Jeffrey K
Bought by
Motsch Jennifer L
Purchase Details
Closed on
Mar 1, 1993
Sold by
Waugh Donald L
Bought by
Jones Jeffrey K
Create a Home Valuation Report for This Property
The Home Valuation Report is an in-depth analysis detailing your home's value as well as a comparison with similar homes in the area
Home Values in the Area
Average Home Value in this Area
Purchase History
| Date | Buyer | Sale Price | Title Company |
|---|---|---|---|
| Happeny Cristi | -- | None Available | |
| Happeny Larry | -- | Attorney | |
| Happeny Cristi | $490,000 | Valleyland Title Agency | |
| Motsch Jennifer L | $80,000 | -- | |
| Jones Jeffrey K | $90,000 | -- |
Source: Public Records
Mortgage History
| Date | Status | Borrower | Loan Amount |
|---|---|---|---|
| Open | Happeny Cristi | $392,000 | |
| Closed | Happeny Cristi | $98,000 |
Source: Public Records
Tax History Compared to Growth
Tax History
| Year | Tax Paid | Tax Assessment Tax Assessment Total Assessment is a certain percentage of the fair market value that is determined by local assessors to be the total taxable value of land and additions on the property. | Land | Improvement |
|---|---|---|---|---|
| 2024 | $20,395 | $252,730 | $30,410 | $222,320 |
| 2023 | $11,038 | $252,730 | $30,410 | $222,320 |
| 2022 | $11,118 | $252,730 | $30,410 | $222,320 |
| 2021 | $8,480 | $189,070 | $25,340 | $163,730 |
| 2020 | $8,583 | $189,070 | $25,340 | $163,730 |
| 2019 | $8,618 | $189,070 | $25,340 | $163,730 |
| 2018 | $7,968 | $164,830 | $33,600 | $131,230 |
| 2017 | $7,477 | $179,270 | $33,600 | $145,670 |
| 2016 | $7,253 | $179,270 | $33,600 | $145,670 |
| 2015 | $6,917 | $166,420 | $33,600 | $132,820 |
| 2014 | $6,611 | $166,420 | $33,600 | $132,820 |
| 2013 | $6,611 | $166,420 | $33,600 | $132,820 |
Source: Public Records
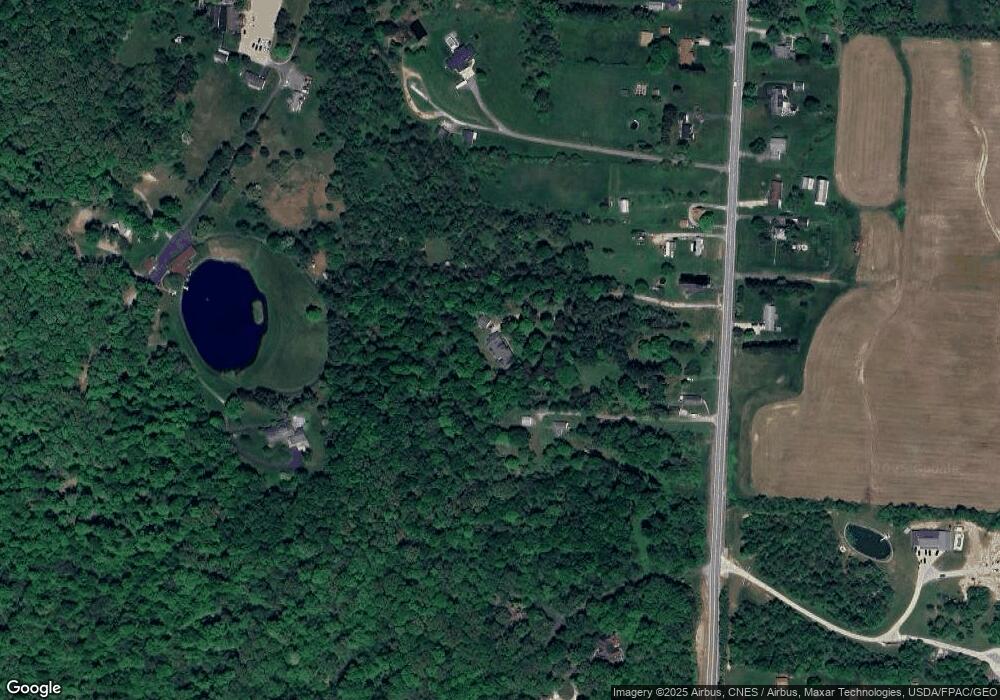
Map
Nearby Homes
- 1080 Coonpath Rd NW
- 626 Rainbow Dr NW
- 2422 Long Bow Ave
- 2361 Calico Ct
- 1833 Autumn Dr
- 1889 Salt Lick Dr
- 2865 Stringtown Rd NW
- 0 Coonpath Rd NW Unit Tract 4 224028093
- 0 Coonpath Rd NW Unit Tract 7 224028097
- 1705 Ginder Rd NW
- 2195 Olde Ridge Ct
- 1715 Tecumseh Dr
- 2695 Two Ridge Ave
- 1632 Bush Hill Dr
- 2699 Fernwood Ave
- 1639 Tecumseh Dr
- 173 Lakeview Dr NE
- 4345 Lancaster Kirkersville Rd NW
- 260 Scott Dr
- 4129 Brook Rd NW
- 2719 Lanc Kirk Rd NW
- 2645 Lancaster Kirkersville Rd NW
- 2645 Lancaster-Kirkersville Rd NW
- 2665 Lanc Kirk Rd NW
- 2731 Lanc Kirk Rd NW
- 2665 Lancaster Kirkersville Rd NW
- 2751 Lancaster Kirkersville Rd NW
- 2801 Lanc Kirk Rd NW
- 2807 Lancaster-Kirkersville Rd NW
- 2771 Lancaster Kirkersville Rd NW
- 2714 Lancaster Kirkersville Rd NW
- 2714 Lancaster-Kirkersville Rd NW
- 2539 Lancaster Kirkersville Rd NW
- 2815 Lan Kirkersville Rd
- 2815 Lanc Kirk Rd NW
- 2760 Lancaster Kirkersville Rd NW
- 2760 Lancaster-Kirkersville Rd NW
- 2760 Lanc Kirk Rd NW
- 2527 Lancaster Kirkersville Rd NW
- 2861 Lancaster Kirkersville Rd NW