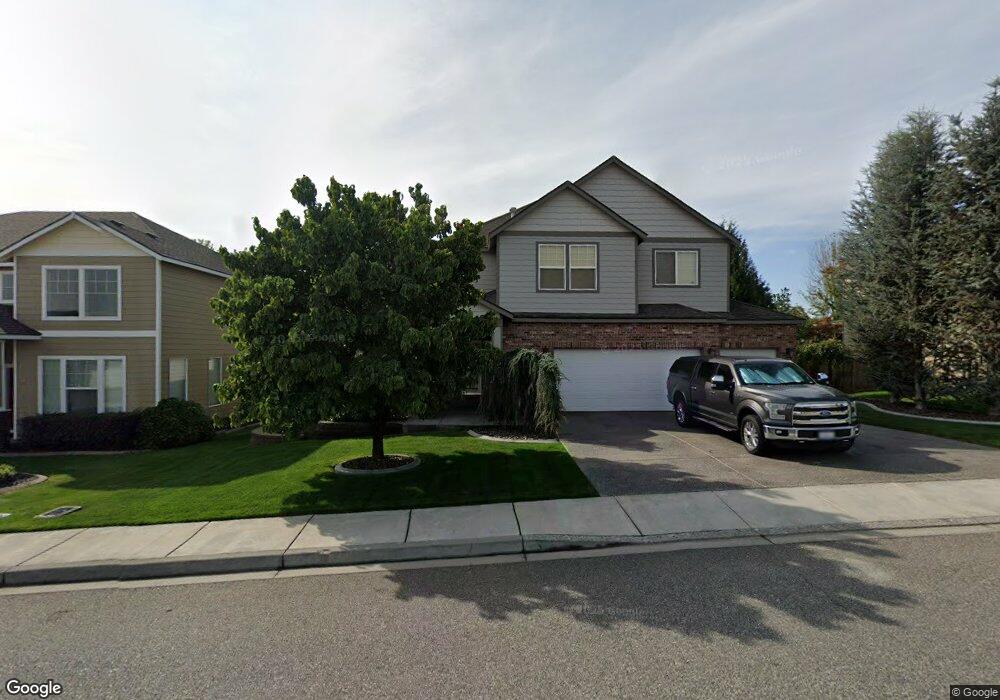
2719 Sawgrass Loop Richland, WA 99354
Estimated Value: $514,681 - $563,000
Studio
3
Baths
2,187
Sq Ft
$247/Sq Ft
Est. Value
About This Home
This home is located at 2719 Sawgrass Loop, Richland, WA 99354 and is currently estimated at $539,170, approximately $246 per square foot. 2719 Sawgrass Loop is a home located in Benton County with nearby schools including Sacajawea Elementary School, Chief Joseph Middle School, and Hanford High School.
Ownership History
Date
Name
Owned For
Owner Type
Purchase Details
Closed on
Apr 18, 2017
Sold by
Eubank Ii Charles T and Eubank India F
Bought by
Eubank Ii Charles T and Eubank India F
Current Estimated Value
Purchase Details
Closed on
Dec 5, 2005
Sold by
Jls Custom Homes Inc
Bought by
Eubank Charles T and Eubank India F
Home Financials for this Owner
Home Financials are based on the most recent Mortgage that was taken out on this home.
Original Mortgage
$32,712
Outstanding Balance
$17,602
Interest Rate
6.14%
Mortgage Type
Credit Line Revolving
Estimated Equity
$521,568
Purchase Details
Closed on
Aug 23, 2005
Sold by
North Stone Richland Llc
Bought by
Jls Custom Homes Inc
Home Financials for this Owner
Home Financials are based on the most recent Mortgage that was taken out on this home.
Original Mortgage
$863,996
Interest Rate
5.61%
Mortgage Type
Construction
Create a Home Valuation Report for This Property
The Home Valuation Report is an in-depth analysis detailing your home's value as well as a comparison with similar homes in the area
Home Values in the Area
Average Home Value in this Area
Purchase History
| Date | Buyer | Sale Price | Title Company |
|---|---|---|---|
| Eubank Ii Charles T | -- | None Available | |
| Eubank Charles T | $217,908 | Chicago Title | |
| Jls Custom Homes Inc | $199,000 | Cascade Title |
Source: Public Records
Mortgage History
| Date | Status | Borrower | Loan Amount |
|---|---|---|---|
| Open | Eubank Charles T | $32,712 | |
| Open | Eubank Charles T | $174,300 | |
| Previous Owner | Jls Custom Homes Inc | $863,996 |
Source: Public Records
Tax History
| Year | Tax Paid | Tax Assessment Tax Assessment Total Assessment is a certain percentage of the fair market value that is determined by local assessors to be the total taxable value of land and additions on the property. | Land | Improvement |
|---|---|---|---|---|
| 2025 | $4,635 | $457,470 | $80,000 | $377,470 |
| 2024 | $4,316 | $497,670 | $70,000 | $427,670 |
| 2023 | $4,316 | $461,010 | $70,000 | $391,010 |
| 2022 | $3,717 | $375,480 | $70,000 | $305,480 |
| 2021 | $3,591 | $336,150 | $70,000 | $266,150 |
| 2020 | $3,797 | $311,950 | $70,000 | $241,950 |
| 2019 | $3,192 | $311,950 | $70,000 | $241,950 |
| 2018 | $3,296 | $282,330 | $52,000 | $230,330 |
| 2017 | $2,906 | $243,940 | $52,000 | $191,940 |
| 2016 | $2,800 | $243,940 | $52,000 | $191,940 |
| 2015 | $2,854 | $238,500 | $52,000 | $186,500 |
| 2014 | -- | $238,500 | $52,000 | $186,500 |
| 2013 | -- | $238,500 | $52,000 | $186,500 |
Source: Public Records
Map
Nearby Homes
- 2940 Sedona Cir
- 2843 Troon Ct
- 2815 Riverbend Dr
- 2601 Eagle Watch Loop
- 2624 Eagle Watch Loop
- 2665 Maidstone St
- 2981 Redrock Ridge Loop
- 3020 Redrock Ridge Loop
- 2713 Torrey Pines Way
- 3294 Wild Canyon Way
- 3359 Village Pkwy
- 2312 Coppercreek St
- NKA Keene Rd
- 2296 Copperleaf St
- 3097 Bobwhite Way
- 80903 N Weidle Rd
- 3170 Mountain Quail Ln
- 3150 Quail Ridge Loop
- 3182 Mountain Quail Ln
- 3263 Emory Ave
- 2723 Sawgrass Loop
- 2713 Sawgrass Loop
- 2951 Sawgrass Loop
- 2963 Sawgrass Loop
- 2729 Sawgrass Loop
- 2707 Sawgrass Loop
- 2943 Sawgrass Loop
- 2969 Sawgrass Loop
- 2718 Sawgrass Loop
- 2712 Sawgrass Loop Unit Amazing view
- 2712 Sawgrass Loop Unit New Quartz Counterto
- 2712 Sawgrass Loop
- 2724 Sawgrass Loop
- 2735 Sawgrass Loop
- 2935 Sawgrass Loop
- 2985 Sawgrass Loop
- 1847 Sawgrass Loop
- 2741 Sawgrass Loop
- 2952 Sawgrass Loop Unit Golf Course frontage
- 2952 Sawgrass Loop Unit Peaceful living on t
Your Personal Tour Guide
Ask me questions while you tour the home.