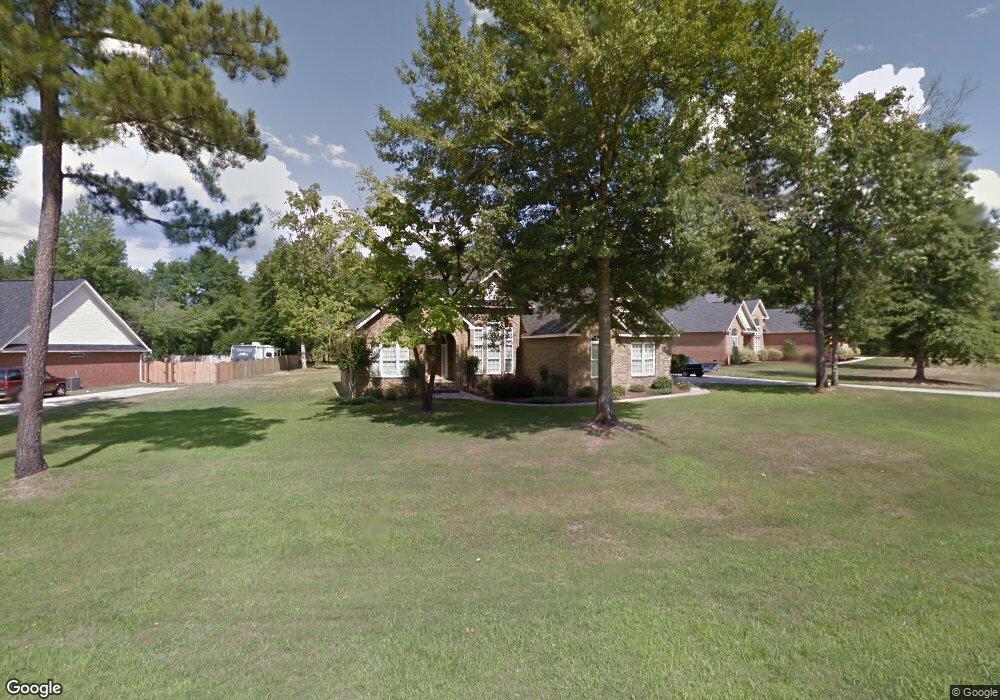
272 Hidden Creek Cir Lizella, GA 31052
Estimated Value: $310,000 - $336,000
3
Beds
2
Baths
2,080
Sq Ft
$154/Sq Ft
Est. Value
About This Home
This home is located at 272 Hidden Creek Cir, Lizella, GA 31052 and is currently estimated at $320,867, approximately $154 per square foot. 272 Hidden Creek Cir is a home located in Bibb County with nearby schools including Skyview Elementary School, Rutland Middle School, and Rutland High School.
Ownership History
Date
Name
Owned For
Owner Type
Purchase Details
Closed on
Aug 31, 2009
Sold by
Zuri Pitts John and Zuri Samuel Devero
Bought by
Pitts John and Pitts Zuri Samuel Devero
Current Estimated Value
Home Financials for this Owner
Home Financials are based on the most recent Mortgage that was taken out on this home.
Original Mortgage
$201,169
Outstanding Balance
$131,296
Interest Rate
5.15%
Mortgage Type
New Conventional
Estimated Equity
$189,571
Purchase Details
Closed on
Jun 20, 2007
Sold by
Bright Star Construction Llc
Bought by
Zuri Pitts John and Zuri Samuel Devero
Home Financials for this Owner
Home Financials are based on the most recent Mortgage that was taken out on this home.
Original Mortgage
$200,300
Interest Rate
6.16%
Mortgage Type
Unknown
Purchase Details
Closed on
Mar 16, 2006
Sold by
Building & Restoratin Group Inc
Bought by
Bright Star Construction Llc
Create a Home Valuation Report for This Property
The Home Valuation Report is an in-depth analysis detailing your home's value as well as a comparison with similar homes in the area
Home Values in the Area
Average Home Value in this Area
Purchase History
| Date | Buyer | Sale Price | Title Company |
|---|---|---|---|
| Pitts John | -- | None Available | |
| Zuri Pitts John | $200,300 | None Available | |
| Bright Star Construction Llc | $266,600 | -- |
Source: Public Records
Mortgage History
| Date | Status | Borrower | Loan Amount |
|---|---|---|---|
| Open | Pitts John | $201,169 | |
| Closed | Zuri Pitts John | $200,300 |
Source: Public Records
Tax History Compared to Growth
Tax History
| Year | Tax Paid | Tax Assessment Tax Assessment Total Assessment is a certain percentage of the fair market value that is determined by local assessors to be the total taxable value of land and additions on the property. | Land | Improvement |
|---|---|---|---|---|
| 2025 | -- | $108,503 | $12,000 | $96,503 |
| 2024 | -- | $108,503 | $12,000 | $96,503 |
| 2023 | $0 | $108,503 | $12,000 | $96,503 |
| 2022 | $3,534 | $93,001 | $10,350 | $82,651 |
| 2021 | $3,107 | $81,769 | $9,450 | $72,319 |
| 2020 | $2,662 | $75,570 | $9,450 | $66,120 |
| 2019 | $2,721 | $76,498 | $9,000 | $67,498 |
| 2018 | $3,870 | $68,557 | $9,000 | $59,557 |
| 2017 | $2,009 | $60,616 | $9,000 | $51,616 |
| 2016 | $1,855 | $60,616 | $9,000 | $51,616 |
| 2015 | $2,626 | $60,616 | $9,000 | $51,616 |
| 2014 | $2,630 | $60,616 | $9,000 | $51,616 |
Source: Public Records
Map
Nearby Homes
- 132 Hidden Creek Cir
- 177 Doublegate Dr
- 173 Doublegate Dr
- 169 Doublegate Dr
- 5771 Rogers Rd
- 6219 Clayts Cir
- 148 Marcar Rd
- 5682 Hartley Bridge Rd
- 218 Jason Way
- 7212 Winterberry Cir
- 6100 Clayts Cir
- 228 Welsh Trail Unit Lot 6
- 228 Welsh Trail Unit LOT 17
- 228 Welsh Trail
- 306 Jason Ct
- 220 Welsh Trail Unit LOT 3
- 220 Welsh Trail
- 227 Welsh Trl Lot #6 Trail Unit Lot 6
- 5397 Mount Pleasant Church Rd Unit Parcel 1
- 5845 Mount Pleasant Church Rd
- 274 Hidden Creek Cir
- 268 Hidden Creek Cir
- 275 Hidden Creek Cir
- 271 Hidden Creek Cir
- 316 Wood Point Ct
- 277 Hidden Creek Cir
- 100 Hidden Creek Cir
- 258 Hidden Creek Cir
- 260 Hidden Creek Cir
- 318 Wood Point Ct
- 267 Hidden Creek Cir
- 200 Hidden Creek Blvd
- 318 Woodpoint Ct
- 104 Hidden Creek Cir
- 265 Hidden Creek Cir
- 312 Wood Point Ct
- 254 Hidden Creek Cir
- 261 Hidden Creek Cir
- 259 Hidden Creek Cir
- 108 Hidden Creek Cir