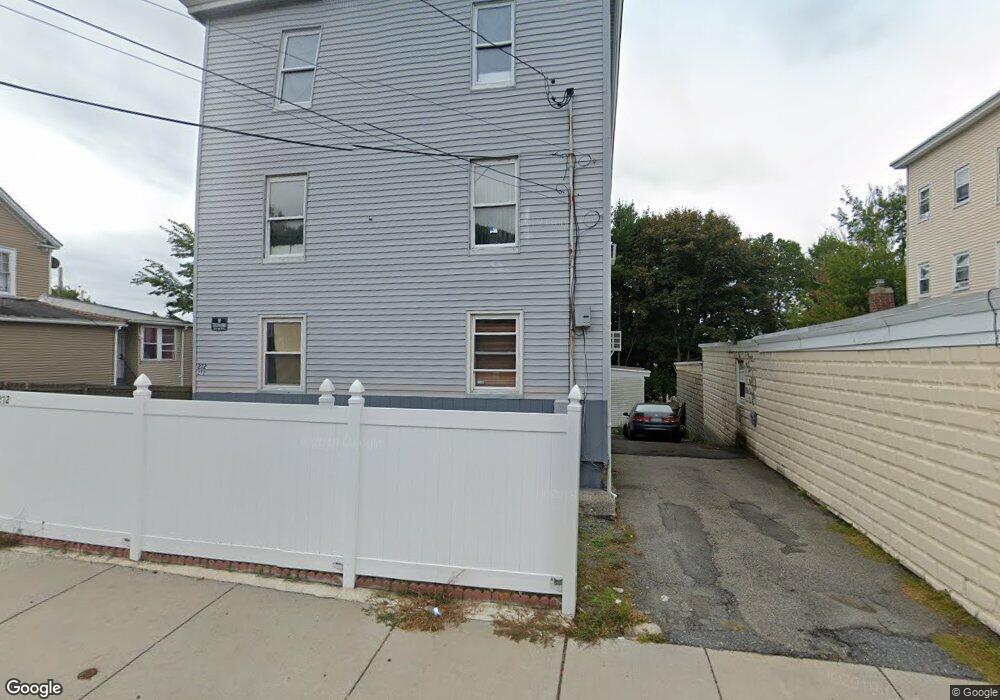
272 High St Lawrence, MA 01841
Prospect Hill-Back Bay NeighborhoodEstimated Value: $563,215 - $884,000
9
Beds
2
Baths
3,519
Sq Ft
$224/Sq Ft
Est. Value
About This Home
This home is located at 272 High St, Lawrence, MA 01841 and is currently estimated at $789,054, approximately $224 per square foot. 272 High St is a home located in Essex County with nearby schools including School For Exceptional Studies, Community Day Charter Public School - Gateway, and Esperanza Academy School of Hope.
Ownership History
Date
Name
Owned For
Owner Type
Purchase Details
Closed on
Jan 4, 2007
Sold by
Hamilton Joseph A and Hamilton Ronda
Bought by
Marte Juan Carlos
Current Estimated Value
Home Financials for this Owner
Home Financials are based on the most recent Mortgage that was taken out on this home.
Original Mortgage
$224,000
Outstanding Balance
$134,085
Interest Rate
6.24%
Mortgage Type
Purchase Money Mortgage
Estimated Equity
$654,969
Purchase Details
Closed on
Feb 27, 1998
Sold by
Hamilton Joseph A
Bought by
Hamilton Joseph A
Home Financials for this Owner
Home Financials are based on the most recent Mortgage that was taken out on this home.
Original Mortgage
$60,000
Interest Rate
6.85%
Mortgage Type
Purchase Money Mortgage
Create a Home Valuation Report for This Property
The Home Valuation Report is an in-depth analysis detailing your home's value as well as a comparison with similar homes in the area
Home Values in the Area
Average Home Value in this Area
Purchase History
| Date | Buyer | Sale Price | Title Company |
|---|---|---|---|
| Marte Juan Carlos | $280,000 | -- | |
| Hamilton Joseph A | $60,000 | -- |
Source: Public Records
Mortgage History
| Date | Status | Borrower | Loan Amount |
|---|---|---|---|
| Open | Marte Juan Carlos | $224,000 | |
| Previous Owner | Hamilton Joseph A | $60,000 |
Source: Public Records
Tax History
| Year | Tax Paid | Tax Assessment Tax Assessment Total Assessment is a certain percentage of the fair market value that is determined by local assessors to be the total taxable value of land and additions on the property. | Land | Improvement |
|---|---|---|---|---|
| 2025 | $5,674 | $644,800 | $118,700 | $526,100 |
| 2024 | $5,556 | $600,600 | $114,700 | $485,900 |
| 2023 | $5,055 | $497,500 | $98,900 | $398,600 |
| 2022 | $4,797 | $419,300 | $91,800 | $327,500 |
| 2021 | $4,567 | $372,200 | $91,800 | $280,400 |
| 2020 | $4,189 | $337,000 | $73,600 | $263,400 |
| 2019 | $4,291 | $313,700 | $76,100 | $237,600 |
| 2018 | $3,955 | $276,200 | $69,300 | $206,900 |
| 2017 | $3,982 | $259,600 | $68,500 | $191,100 |
| 2016 | $3,521 | $227,000 | $45,700 | $181,300 |
| 2015 | $3,301 | $218,300 | $45,700 | $172,600 |
Source: Public Records
Map
Nearby Homes
- 162 E Haverhill St
- 192 Union St
- 109 Ferry St
- 80-82 Haverhill St
- 5 Kendrick St
- 89 Newbury St Unit 89B
- 91 Summer St Unit 2
- 2 Cherry St
- 52 Howard St
- 106 Leroy Ave
- 264 E Haverhill St Unit 2
- 7 Stevens Ct
- 27 Woodland Ct
- 39 Swan Ave
- 14 Court St
- 32 Josephine Ave
- 131A Lawrence St Unit 40
- 18 Erhardt Terrace
- 11 Lawrence St Unit 606
- 12 Annette St
- 14-16 Grove St Unit 1
- 14-16 Grove St
- 278 High St Unit 282
- 14 Grove St Unit 16
- 14 Grove St Unit 1
- 264-266 High St
- 264 High St Unit 266
- 10-12 Grove St
- 284 High St
- 265 High St
- 277 High St
- 10 Grove St Unit 12
- 6 Grove St
- 283 High St
- 15 Grove St
- 13 Grove St
- 13 -15 Grove St
- 285 High St
- 288-290 High St
- 288 High St Unit 290
Your Personal Tour Guide
Ask me questions while you tour the home.