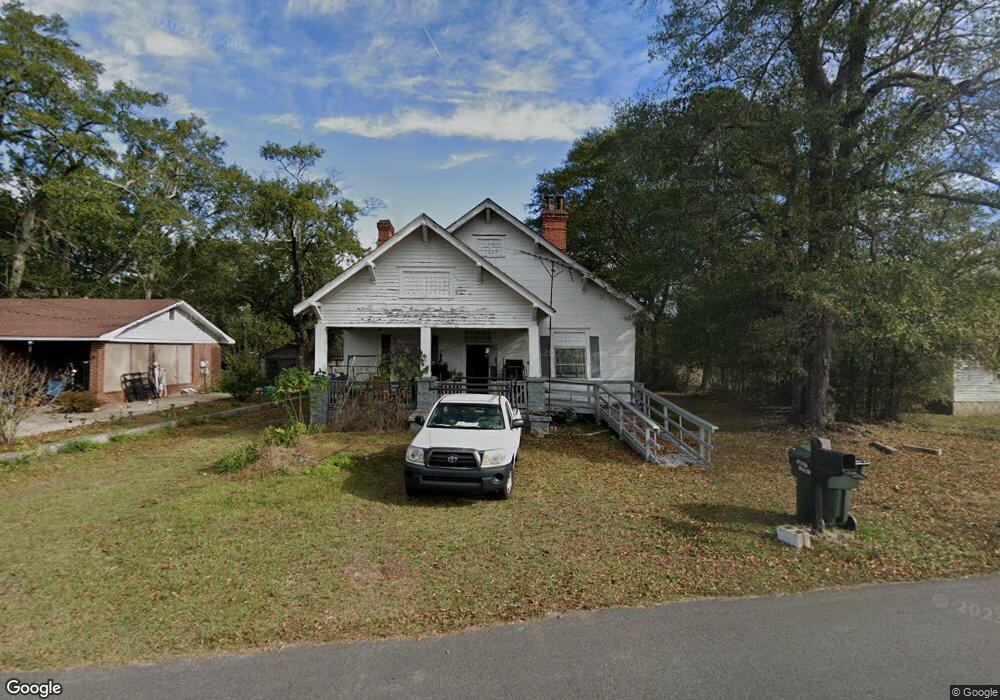
272 Highland Park Elberton, GA 30635
Estimated Value: $101,246 - $187,000
--
Bed
1
Bath
1,980
Sq Ft
$77/Sq Ft
Est. Value
About This Home
This home is located at 272 Highland Park, Elberton, GA 30635 and is currently estimated at $151,562, approximately $76 per square foot. 272 Highland Park is a home located in Elbert County with nearby schools including Elbert County Elementary School, Elbert County Primary School, and Elbert County Middle School.
Ownership History
Date
Name
Owned For
Owner Type
Purchase Details
Closed on
May 31, 2005
Sold by
Mize Property Holdings Ii Llc 0
Bought by
Dye Kizzie Yvonne
Current Estimated Value
Purchase Details
Closed on
Apr 14, 2005
Sold by
Mize Jimmy
Bought by
Mize Property Holdings Ii Llc
Purchase Details
Closed on
Oct 1, 2002
Sold by
Woods Marty and Woods Becca
Bought by
Mize Jimmy
Purchase Details
Closed on
Feb 15, 2002
Sold by
Mize Jimmy
Bought by
Woods Marty and Woods Becca
Purchase Details
Closed on
Dec 4, 2001
Sold by
Wall Marilyn
Bought by
Mize Jimmy
Purchase Details
Closed on
Jul 1, 1997
Sold by
Mize Jimmy
Bought by
Wall Marilyn
Purchase Details
Closed on
Jul 1, 1996
Sold by
Horton Michael John
Bought by
Mize Jimmy
Purchase Details
Closed on
Mar 1, 1989
Sold by
Burt David A and Burt Margie F
Bought by
Horton Michael John and Horton Patricia A
Purchase Details
Closed on
Jun 1, 1984
Sold by
Johnson Martha C
Bought by
Burt David A
Purchase Details
Closed on
Dec 1, 1964
Create a Home Valuation Report for This Property
The Home Valuation Report is an in-depth analysis detailing your home's value as well as a comparison with similar homes in the area
Home Values in the Area
Average Home Value in this Area
Purchase History
| Date | Buyer | Sale Price | Title Company |
|---|---|---|---|
| Dye Kizzie Yvonne | $63,000 | -- | |
| Mize Property Holdings Ii Llc | -- | -- | |
| Mize Jimmy | -- | -- | |
| Woods Marty | $46,000 | -- | |
| Mize Jimmy | -- | -- | |
| Wall Marilyn | $45,000 | -- | |
| Mize Jimmy | $26,000 | -- | |
| Horton Michael John | $24,000 | -- | |
| Burt David A | $13,000 | -- | |
| -- | $13,200 | -- |
Source: Public Records
Tax History Compared to Growth
Tax History
| Year | Tax Paid | Tax Assessment Tax Assessment Total Assessment is a certain percentage of the fair market value that is determined by local assessors to be the total taxable value of land and additions on the property. | Land | Improvement |
|---|---|---|---|---|
| 2024 | $896 | $36,435 | $3,233 | $33,202 |
| 2023 | $640 | $36,435 | $3,233 | $33,202 |
| 2022 | $346 | $24,054 | $3,233 | $20,821 |
| 2021 | $547 | $24,054 | $3,233 | $20,821 |
| 2020 | $497 | $20,015 | $3,592 | $16,423 |
| 2019 | $513 | $20,015 | $3,592 | $16,423 |
| 2018 | $610 | $22,959 | $3,592 | $19,367 |
| 2017 | $491 | $17,626 | $3,592 | $14,034 |
| 2016 | $459 | $17,626 | $3,592 | $14,034 |
| 2015 | -- | $17,626 | $3,592 | $14,034 |
| 2014 | -- | $22,016 | $3,592 | $18,423 |
| 2013 | -- | $22,016 | $3,592 | $18,423 |
Source: Public Records
Map
Nearby Homes
- 243 W Tate St
- 0 Pulliam St Unit 7659662
- 0 Pulliam St Unit 10616872
- 381 College Ave
- 89 College Ave
- 345 N Oliver St
- 136 Forest Ave
- 1020 Hickory Dr
- 346 N Oliver St
- 170 Lake Forest Dr
- 1133 Kathwood Dr
- 62 Oak St
- 0 Sara Jane Dr Unit 10501253
- 968 Ext Elbert St
- 108 Brookhaven Cir
- 44 Clairmont Ave
- 118 Oak Dr
- 143 Lake Forest Cir
- 0 Oak Dr Unit 7643600
- 0 Oak Dr Unit 10598083
- 266 Highland Park
- 274 Highland Park
- 276 Highland Park
- 258 Highland Park
- 208 Highland Ave
- 286 Highland Park
- W W Railroad St
- 215 Highland Ave
- 2265 Highland Park
- 117 Highland Ave
- 0 Highland Ave Unit 8527261
- 290 Highland Park
- 277 W Railroad St
- 248 Highland Park
- 115 Highland Ave
- 300 Highland Park
- 116 Highland Ave
- 300 Highland Park
- 228 Sunnyside Ave
- 269 W Tate St