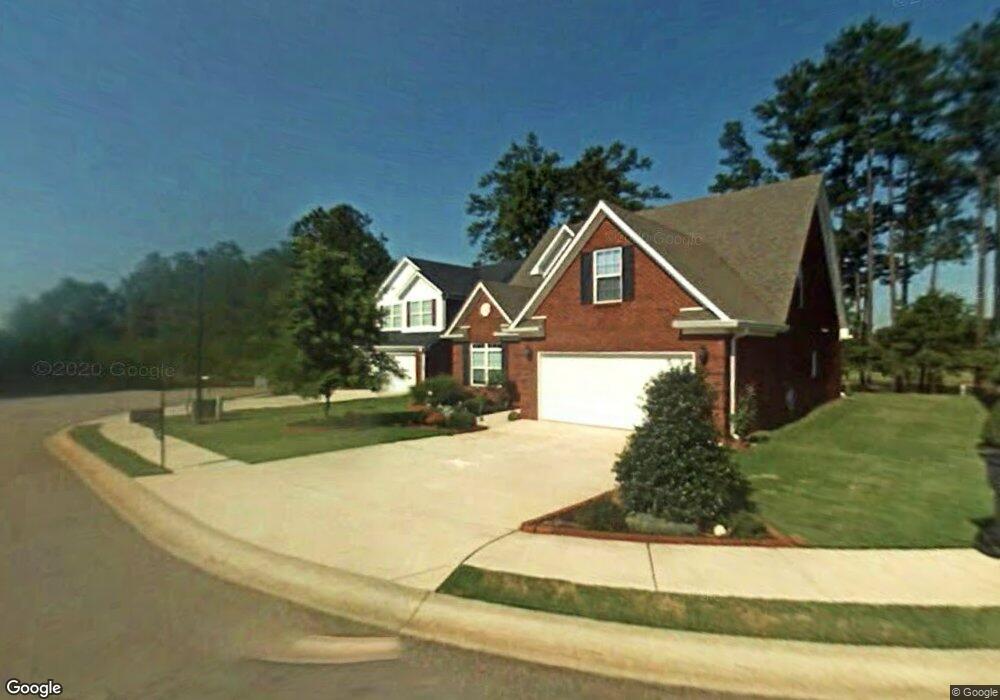
272 Long Dr Unit 27 McDonough, GA 30253
Estimated Value: $296,000 - $307,000
4
Beds
3
Baths
1,949
Sq Ft
$154/Sq Ft
Est. Value
About This Home
This home is located at 272 Long Dr Unit 27, McDonough, GA 30253 and is currently estimated at $299,947, approximately $153 per square foot. 272 Long Dr Unit 27 is a home located in Henry County with nearby schools including Oakland Elementary School, McDonough Middle School, and McDonough Methodist Academy.
Ownership History
Date
Name
Owned For
Owner Type
Purchase Details
Closed on
Oct 15, 2019
Sold by
Brown Margaret
Bought by
Brown Living Trust
Current Estimated Value
Purchase Details
Closed on
May 25, 2018
Sold by
Holt Joshua
Bought by
Brown Margaret
Purchase Details
Closed on
Sep 12, 2008
Sold by
Decatur Properties Inc
Bought by
Holt Joshua
Home Financials for this Owner
Home Financials are based on the most recent Mortgage that was taken out on this home.
Original Mortgage
$144,571
Interest Rate
6.49%
Mortgage Type
FHA
Purchase Details
Closed on
Mar 31, 2006
Sold by
Peachtree Natl Bk
Bought by
Griffin Shawn P
Home Financials for this Owner
Home Financials are based on the most recent Mortgage that was taken out on this home.
Original Mortgage
$594,483
Interest Rate
6.23%
Mortgage Type
New Conventional
Purchase Details
Closed on
Oct 4, 2005
Sold by
Ronnie Ward Hms Inc
Bought by
Peachtree Natl Bk
Create a Home Valuation Report for This Property
The Home Valuation Report is an in-depth analysis detailing your home's value as well as a comparison with similar homes in the area
Home Values in the Area
Average Home Value in this Area
Purchase History
| Date | Buyer | Sale Price | Title Company |
|---|---|---|---|
| Brown Living Trust | -- | -- | |
| Brown Margaret | $170,900 | -- | |
| Holt Joshua | $145,000 | -- | |
| Griffin Shawn P | $285,000 | -- | |
| Peachtree Natl Bk | $55,758 | -- |
Source: Public Records
Mortgage History
| Date | Status | Borrower | Loan Amount |
|---|---|---|---|
| Previous Owner | Holt Joshua | $144,571 | |
| Previous Owner | Griffin Shawn P | $594,483 |
Source: Public Records
Tax History Compared to Growth
Tax History
| Year | Tax Paid | Tax Assessment Tax Assessment Total Assessment is a certain percentage of the fair market value that is determined by local assessors to be the total taxable value of land and additions on the property. | Land | Improvement |
|---|---|---|---|---|
| 2025 | $4,398 | $117,960 | $17,600 | $100,360 |
| 2024 | $4,398 | $121,480 | $17,600 | $103,880 |
| 2023 | $4,426 | $118,080 | $13,200 | $104,880 |
| 2022 | $3,433 | $89,400 | $13,200 | $76,200 |
| 2021 | $2,956 | $75,320 | $13,200 | $62,120 |
| 2020 | $2,688 | $68,080 | $8,800 | $59,280 |
| 2019 | $2,151 | $62,040 | $8,800 | $53,240 |
| 2018 | $2,133 | $59,080 | $7,920 | $51,160 |
| 2016 | $1,801 | $49,320 | $7,920 | $41,400 |
| 2015 | $1,636 | $43,920 | $7,920 | $36,000 |
| 2014 | $1,126 | $32,320 | $7,920 | $24,400 |
Source: Public Records
Map
Nearby Homes
- 272 Long Dr
- 1330 Labonte Pkwy
- 243 Long Dr
- 3045 Hendrick Dr
- 1120 Labonte Pkwy
- 1705 Labonte Pkwy
- 1138 McConaughy Ct
- 1028 McConaughy Ct Unit 14
- 43 George W Lemon Dr
- 43 George Lemon Dr
- 816 Royal Red Ct
- 90 King Blvd
- 61 Cherry St
- 133 Fairview Rd
- 34 Cherry St
- 38 Head St
- 169 Parkview Place Dr
- 273 Village Dr
- 173 Parkview Place Dr
- 5060 Pioneer Pkwy