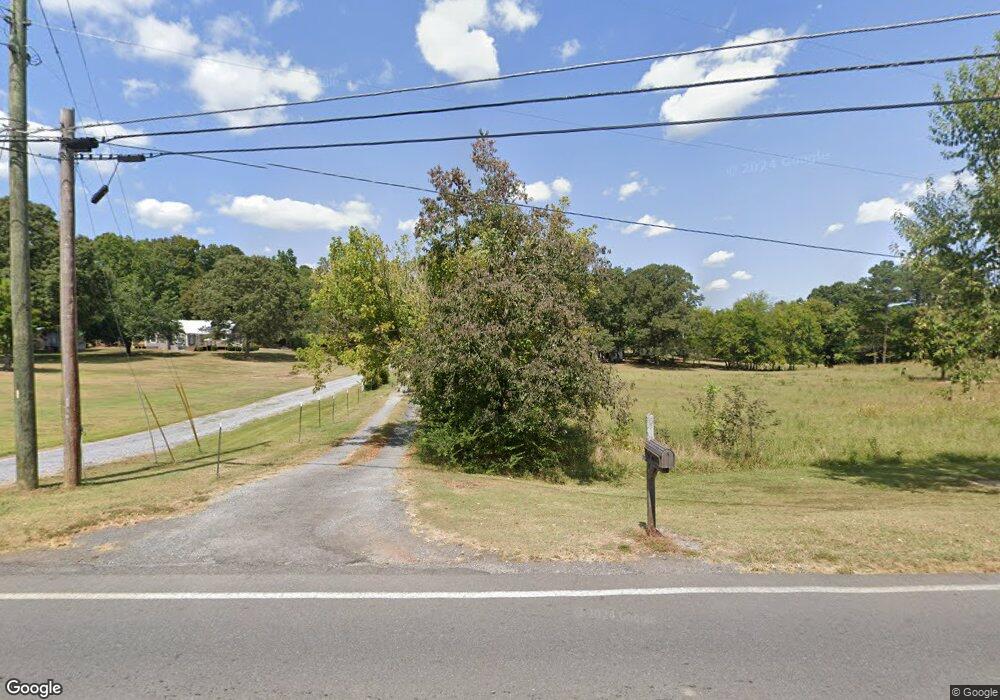
272 Maple Grove Rd NW Dalton, GA 30721
Estimated Value: $204,462 - $273,000
--
Bed
1
Bath
1,144
Sq Ft
$198/Sq Ft
Est. Value
About This Home
This home is located at 272 Maple Grove Rd NW, Dalton, GA 30721 and is currently estimated at $226,866, approximately $198 per square foot. 272 Maple Grove Rd NW is a home located in Whitfield County with nearby schools including Varnell Elementary School, Coahulla Creek High School, and Cedar Valley Christian Academy.
Ownership History
Date
Name
Owned For
Owner Type
Purchase Details
Closed on
Jun 20, 2019
Sold by
Brooker Jackie L
Bought by
Brooker John Bailey
Current Estimated Value
Home Financials for this Owner
Home Financials are based on the most recent Mortgage that was taken out on this home.
Original Mortgage
$120,000
Outstanding Balance
$104,851
Interest Rate
4%
Mortgage Type
New Conventional
Estimated Equity
$122,015
Purchase Details
Closed on
Jul 7, 2016
Sold by
Anne Jaye
Bought by
Brooker Jackie L
Purchase Details
Closed on
Mar 24, 2005
Sold by
Not Provided
Bought by
Creswell Bobby R
Purchase Details
Closed on
Sep 22, 2004
Sold by
Creswell Houston C
Bought by
Hefner Leonard Etal
Purchase Details
Closed on
Jun 25, 2003
Sold by
Creswell Dortha Margurite
Bought by
Creswell Houston C
Purchase Details
Closed on
Jul 1, 1996
Bought by
Creswell Dortha Margurite
Create a Home Valuation Report for This Property
The Home Valuation Report is an in-depth analysis detailing your home's value as well as a comparison with similar homes in the area
Home Values in the Area
Average Home Value in this Area
Purchase History
| Date | Buyer | Sale Price | Title Company |
|---|---|---|---|
| Brooker John Bailey | $150,000 | -- | |
| Brooker Jackie L | $77,000 | -- | |
| Creswell Bobby R | -- | -- | |
| Hefner Leonard Etal | -- | -- | |
| Creswell Houston C | -- | -- | |
| Creswell Dortha Margurite | $14,300 | -- |
Source: Public Records
Mortgage History
| Date | Status | Borrower | Loan Amount |
|---|---|---|---|
| Open | Brooker John Bailey | $120,000 |
Source: Public Records
Tax History Compared to Growth
Tax History
| Year | Tax Paid | Tax Assessment Tax Assessment Total Assessment is a certain percentage of the fair market value that is determined by local assessors to be the total taxable value of land and additions on the property. | Land | Improvement |
|---|---|---|---|---|
| 2024 | $615 | $59,082 | $17,398 | $41,684 |
| 2023 | $615 | $27,058 | $17,128 | $9,930 |
| 2022 | $608 | $29,155 | $15,039 | $14,116 |
| 2021 | $608 | $29,155 | $15,039 | $14,116 |
| 2020 | $617 | $29,155 | $15,039 | $14,116 |
| 2019 | $904 | $29,155 | $15,039 | $14,116 |
| 2018 | $854 | $27,105 | $12,989 | $14,116 |
| 2017 | $854 | $27,105 | $12,989 | $14,116 |
| 2016 | $789 | $26,012 | $12,989 | $13,023 |
| 2014 | $722 | $26,835 | $13,812 | $13,023 |
| 2013 | -- | $26,834 | $13,811 | $13,023 |
Source: Public Records
Map
Nearby Homes
- 316 Maple Grove Rd NW
- 3450 Misty Meadows Dr NW
- 3201 Maple Grove Dr NW
- 154 Brylow Dr Unit 92, pt 91
- 124 Timbervale Dr
- 0 Oakstone Way NW Unit 125185
- 329 Kempton Ln
- 213 Oakstone Way
- 3250 Rolling Meadows Rd NW
- 194 Cheyenne Trail NW
- 360 Pacer Ln
- 337 Pacer Ln Unit 4
- 322 Pacer Ln
- 0 Pacer Ln
- 230 Pacer Ln
- 222 Pacer Ln
- 3050 Cleveland Hwy
- 2002 Broadacre Dr NW
- 3216 Cleveland Hwy
- 00 Cleveland Hwy
- 298 Maple Grove Rd NW
- 427 Bloomington Dr
- 439 Bloomington Dr
- 300 Maple Grove Rd NW
- 393 Bloomington Dr
- 438 Bloomington Dr
- 423 Bloomington Dr
- 440 Bloomington Dr
- 254 Maple Grove Rd NW
- 432 Bloomington Dr
- 308 Maple Grove Rd NW
- 383 Bloomington Dr
- 420 Bloomington Dr
- 3248 Maple Grove Dr NW
- 275 Maple Grove Rd NW
- 265 Maple Grove Rd NW
- 0 Maple Grove Rd Unit 1199156
- 0 Maple Grove Rd
- 382 Bloomington Dr
- 273 Brylow Dr