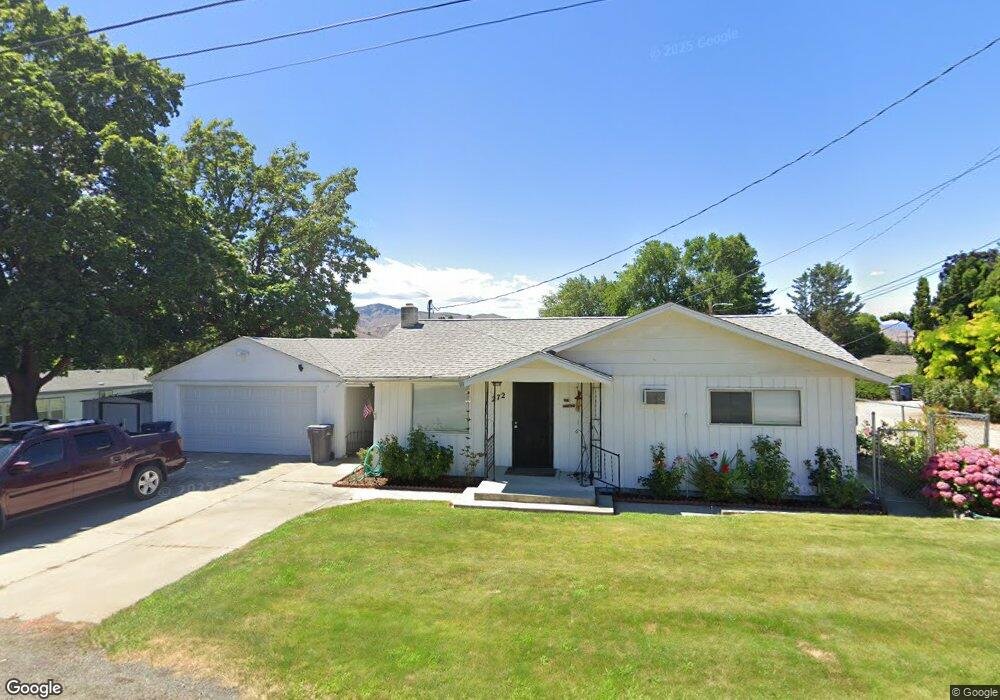
272 N Joseph Ave East Wenatchee, WA 98802
Estimated Value: $461,000 - $587,000
3
Beds
2
Baths
1,401
Sq Ft
$368/Sq Ft
Est. Value
About This Home
This home is located at 272 N Joseph Ave, East Wenatchee, WA 98802 and is currently estimated at $515,468, approximately $367 per square foot. 272 N Joseph Ave is a home located in Douglas County with nearby schools including Kenroy Elementary School, Clovis Point Intermediate School, and Eastmont Junior High School.
Ownership History
Date
Name
Owned For
Owner Type
Purchase Details
Closed on
Feb 9, 2021
Sold by
Martin Carey A
Bought by
Martin Carey A and Martin Connie L
Current Estimated Value
Home Financials for this Owner
Home Financials are based on the most recent Mortgage that was taken out on this home.
Original Mortgage
$115,900
Outstanding Balance
$103,480
Interest Rate
2.6%
Mortgage Type
New Conventional
Estimated Equity
$411,988
Purchase Details
Closed on
Dec 28, 2010
Sold by
Martin Connie L
Bought by
Martin Carey A
Home Financials for this Owner
Home Financials are based on the most recent Mortgage that was taken out on this home.
Original Mortgage
$111,280
Interest Rate
4.34%
Mortgage Type
New Conventional
Purchase Details
Closed on
Dec 27, 2010
Sold by
Haney Colin W and Haney M
Bought by
Martin Carey A
Home Financials for this Owner
Home Financials are based on the most recent Mortgage that was taken out on this home.
Original Mortgage
$111,280
Interest Rate
4.34%
Mortgage Type
New Conventional
Create a Home Valuation Report for This Property
The Home Valuation Report is an in-depth analysis detailing your home's value as well as a comparison with similar homes in the area
Home Values in the Area
Average Home Value in this Area
Purchase History
| Date | Buyer | Sale Price | Title Company |
|---|---|---|---|
| Martin Carey A | -- | Accommodation | |
| Martin Carey A | -- | First American Title Ins Co | |
| Martin Carey A | $161,828 | First American Title Ins Co |
Source: Public Records
Mortgage History
| Date | Status | Borrower | Loan Amount |
|---|---|---|---|
| Open | Martin Carey A | $115,900 | |
| Closed | Martin Carey A | $111,280 |
Source: Public Records
Tax History Compared to Growth
Tax History
| Year | Tax Paid | Tax Assessment Tax Assessment Total Assessment is a certain percentage of the fair market value that is determined by local assessors to be the total taxable value of land and additions on the property. | Land | Improvement |
|---|---|---|---|---|
| 2025 | $400 | $509,000 | $131,000 | $378,000 |
| 2024 | $4,348 | $470,500 | $131,000 | $339,500 |
| 2023 | $4,076 | $377,500 | $131,000 | $246,500 |
| 2022 | $3,777 | $330,800 | $81,000 | $249,800 |
| 2021 | $3,962 | $330,800 | $81,000 | $249,800 |
| 2020 | $3,927 | $322,200 | $81,000 | $241,200 |
| 2018 | $2,887 | $228,800 | $63,600 | $165,200 |
| 2017 | $2,256 | $228,800 | $63,600 | $165,200 |
| 2016 | $1,968 | $190,900 | $63,600 | $127,300 |
| 2015 | $1,905 | $176,400 | $63,600 | $112,800 |
| 2014 | -- | $163,700 | $63,600 | $100,100 |
| 2013 | -- | $160,800 | $63,600 | $97,200 |
Source: Public Records
Map
Nearby Homes
- 128 N June Ave
- 475 N Kansas Ave
- 322 N Kentucky Ave Unit A&B
- 1598 Tedford St SE
- 772 N Keller Ave
- 182 S Keller Ave
- 17 S Lombard Ave
- 646 N Gale Place
- 800 N Kentucky Ave
- 211 S Pace Dr Unit 30
- 1718 8th St NE
- 1981 Grant Rd
- 369 S Kentucky Ave
- 902 N Kenroy Terrace
- 1102 Carolyn St
- 1810 9th St NE
- 39 Mandolin Ave
- 561 Morning View Ave
- 544 N Colorado Ave
- 539 S Joseph Ave
- 268 N Joseph Ave
- 282 N Joseph Ave
- 278 N Joseph Ave
- 273 N James Ave
- 279 N James Ave
- 292 N Joseph Ave
- 277 N Joseph Ave
- 1258 3rd St NE
- 285 N James Ave
- 275 N Joseph Ave
- 283 N Joseph Ave
- 145 N James Ave
- 1250 3rd St NE
- 1300 3rd St NE
- 137 N James Ave
- 287 N James Ave
- 141 N Joseph Ave
- 129 N James Ave
- 128 N Joseph Ave
- 1269 3rd St NE