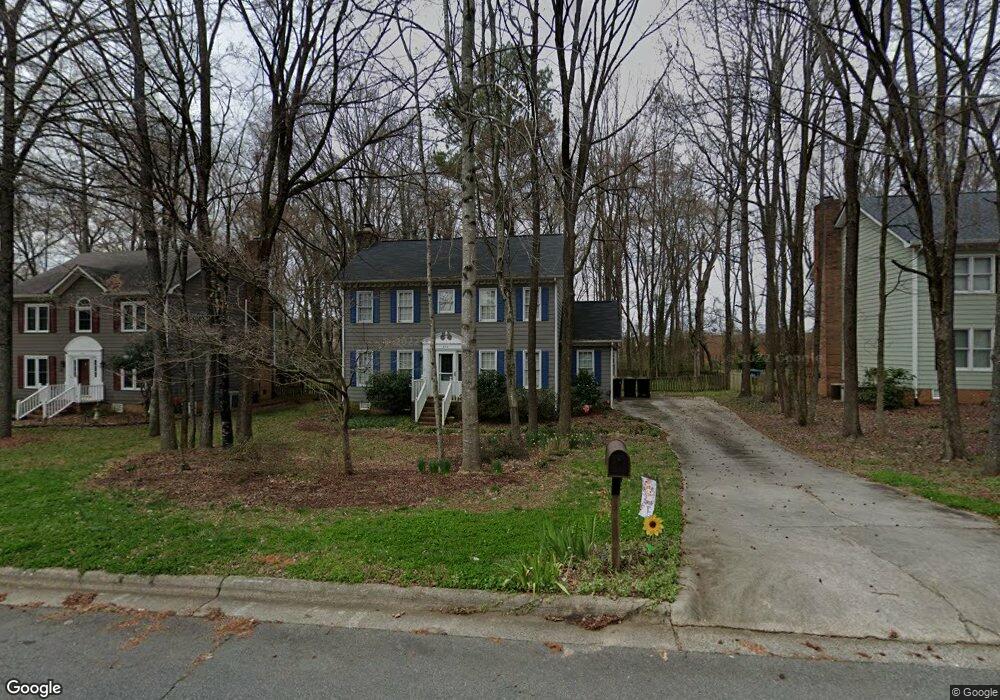
272 Post Oak Ave SW Concord, NC 28025
Estimated Value: $335,729 - $356,000
3
Beds
3
Baths
1,761
Sq Ft
$197/Sq Ft
Est. Value
About This Home
This home is located at 272 Post Oak Ave SW, Concord, NC 28025 and is currently estimated at $347,432, approximately $197 per square foot. 272 Post Oak Ave SW is a home located in Cabarrus County with nearby schools including R Brown Mcallister STEMElementary, Concord Middle School, and Concord High School.
Ownership History
Date
Name
Owned For
Owner Type
Purchase Details
Closed on
Jul 19, 2012
Sold by
Caves Karla G
Bought by
Enlow Jessica Lynette and Enlow Matthew Philip
Current Estimated Value
Purchase Details
Closed on
May 12, 2006
Sold by
Scott Edward C and Scott Noelle R
Bought by
Eaves Karla G
Home Financials for this Owner
Home Financials are based on the most recent Mortgage that was taken out on this home.
Original Mortgage
$22,200
Interest Rate
6.39%
Mortgage Type
Unknown
Purchase Details
Closed on
Aug 1, 1995
Bought by
Scott Edward C and Scott Wife
Purchase Details
Closed on
Apr 1, 1991
Purchase Details
Closed on
Aug 1, 1987
Create a Home Valuation Report for This Property
The Home Valuation Report is an in-depth analysis detailing your home's value as well as a comparison with similar homes in the area
Home Values in the Area
Average Home Value in this Area
Purchase History
| Date | Buyer | Sale Price | Title Company |
|---|---|---|---|
| Enlow Jessica Lynette | $151,000 | None Available | |
| Eaves Karla G | $148,000 | Chicago Title Insurance Co | |
| Scott Edward C | $116,000 | -- | |
| -- | $97,000 | -- | |
| -- | $97,500 | -- |
Source: Public Records
Mortgage History
| Date | Status | Borrower | Loan Amount |
|---|---|---|---|
| Previous Owner | Eaves Karla G | $22,200 | |
| Previous Owner | Eaves Karla G | $118,400 |
Source: Public Records
Tax History Compared to Growth
Tax History
| Year | Tax Paid | Tax Assessment Tax Assessment Total Assessment is a certain percentage of the fair market value that is determined by local assessors to be the total taxable value of land and additions on the property. | Land | Improvement |
|---|---|---|---|---|
| 2025 | $2,888 | $289,940 | $78,000 | $211,940 |
| 2024 | $2,888 | $289,940 | $78,000 | $211,940 |
| 2023 | $1,954 | $160,150 | $40,000 | $120,150 |
| 2022 | $1,954 | $160,150 | $40,000 | $120,150 |
| 2021 | $1,954 | $160,150 | $40,000 | $120,150 |
| 2020 | $1,954 | $160,150 | $40,000 | $120,150 |
| 2019 | $1,704 | $139,700 | $36,000 | $103,700 |
| 2018 | $1,676 | $139,700 | $36,000 | $103,700 |
| 2017 | $1,648 | $139,700 | $36,000 | $103,700 |
| 2016 | $978 | $136,210 | $36,000 | $100,210 |
| 2015 | $1,607 | $136,210 | $36,000 | $100,210 |
| 2014 | $1,607 | $136,210 | $36,000 | $100,210 |
Source: Public Records
Map
Nearby Homes
- 309 Brightwood Ct SW
- 501 Journey St SW
- 671 Sylvan St SW
- 736 Spring St SW
- 344 Lincoln St SW
- 355 Melrose Dr SW Unit F
- 355 Melrose Dr SW Unit A
- 336 Lincoln St SW
- 571 Union St S
- 569 Union St S
- 85 Myrtle Ave SW
- 783 Union St S
- 330 Malvern Dr SW Unit H
- 330 Malvern Dr SW Unit B
- 330 Malvern Dr SW Unit A
- 229 Boger Ct SW
- 564 Union St S
- 758 Ideal Dr SE
- 302 Melrose Dr SW
- 294 Melrose Dr SW
- 270 Post Oak Ave SW
- 274 Post Oak Ave SW
- 268 Post Oak Ave SW
- 276 Post Oak Ave SW
- 00 Post Oak Ave SW Unit 55
- 269 Post Oak Ave SW
- 266 Post Oak Ave SW
- 278 Post Oak Ave SW
- 271 Post Oak Ave SW
- 267 Post Oak Ave SW
- 273 Post Oak Ave SW
- 272 Lemon Tree Ln SW
- 280 Post Oak Ave SW
- 264 Post Oak Ave SW
- 265 Post Oak Ave SW
- 270 Lemon Tree Ln SW
- 275 Post Oak Ave SW
- 289 Fryling Ave SW
- 268 Lemon Tree Ln SW
- 266 Lemon Tree Ln SW