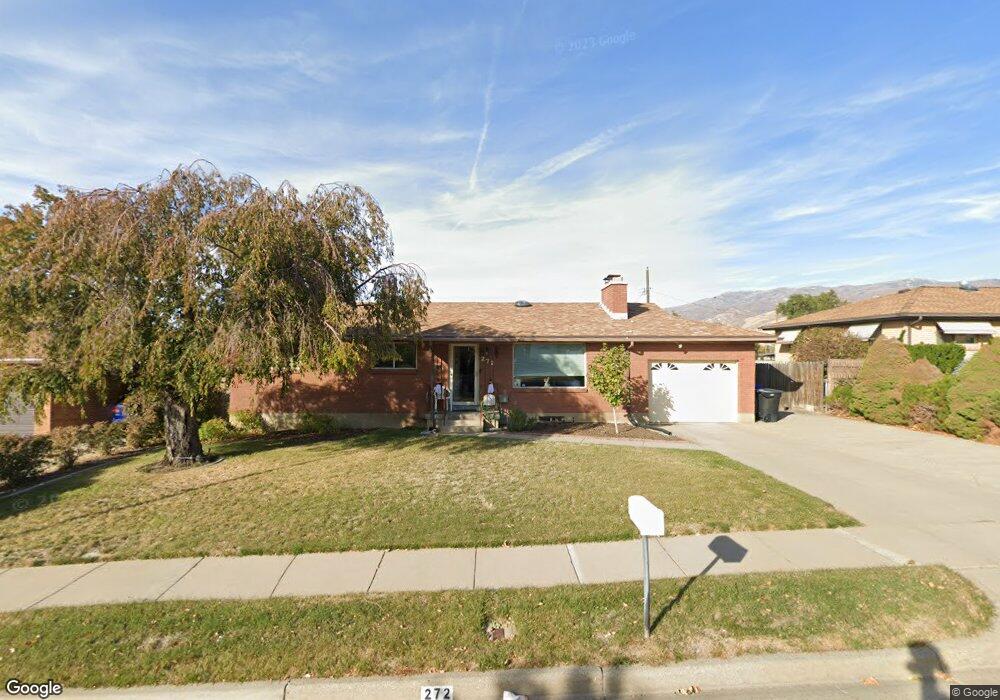
272 W 2300 S Bountiful, UT 84010
Estimated Value: $547,000 - $558,410
4
Beds
2
Baths
2,597
Sq Ft
$212/Sq Ft
Est. Value
About This Home
This home is located at 272 W 2300 S, Bountiful, UT 84010 and is currently estimated at $550,603, approximately $212 per square foot. 272 W 2300 S is a home located in Davis County with nearby schools including Boulton School, South Davis Junior High School, and Woods Cross High School.
Ownership History
Date
Name
Owned For
Owner Type
Purchase Details
Closed on
Nov 14, 2017
Sold by
Cross Michael Ray
Bought by
Cross Sharon D
Current Estimated Value
Home Financials for this Owner
Home Financials are based on the most recent Mortgage that was taken out on this home.
Original Mortgage
$179,800
Outstanding Balance
$150,545
Interest Rate
3.91%
Mortgage Type
New Conventional
Estimated Equity
$400,058
Purchase Details
Closed on
Jul 27, 2004
Sold by
Larson E Leroy and Larson Elouise B
Bought by
Cross Michael Ray and Cross Sharon D
Home Financials for this Owner
Home Financials are based on the most recent Mortgage that was taken out on this home.
Original Mortgage
$150,500
Interest Rate
6.29%
Mortgage Type
Purchase Money Mortgage
Purchase Details
Closed on
Oct 19, 1999
Sold by
Larson Earl Leroy and Larson Elouise B
Bought by
Larson E Leroy and Larson Elouise B
Create a Home Valuation Report for This Property
The Home Valuation Report is an in-depth analysis detailing your home's value as well as a comparison with similar homes in the area
Home Values in the Area
Average Home Value in this Area
Purchase History
| Date | Buyer | Sale Price | Title Company |
|---|---|---|---|
| Cross Sharon D | -- | -- | |
| Cross Michael Ray | -- | Bonneville Title Company Inc | |
| Larson E Leroy | -- | -- |
Source: Public Records
Mortgage History
| Date | Status | Borrower | Loan Amount |
|---|---|---|---|
| Open | Cross Sharon D | $179,800 | |
| Closed | Cross Michael Ray | $150,500 |
Source: Public Records
Tax History Compared to Growth
Tax History
| Year | Tax Paid | Tax Assessment Tax Assessment Total Assessment is a certain percentage of the fair market value that is determined by local assessors to be the total taxable value of land and additions on the property. | Land | Improvement |
|---|---|---|---|---|
| 2025 | $3,103 | $282,150 | $122,184 | $159,966 |
| 2024 | $2,896 | $272,800 | $107,919 | $164,881 |
| 2023 | $2,694 | $459,000 | $200,887 | $258,113 |
| 2022 | $2,658 | $248,050 | $110,330 | $137,720 |
| 2021 | $2,421 | $345,000 | $144,291 | $200,709 |
| 2020 | $2,145 | $306,000 | $124,015 | $181,985 |
| 2019 | $2,166 | $302,000 | $136,245 | $165,755 |
| 2018 | $2,028 | $278,000 | $133,676 | $144,324 |
| 2016 | $1,719 | $127,160 | $53,886 | $73,274 |
| 2015 | $1,644 | $114,565 | $53,886 | $60,679 |
| 2014 | $1,798 | $129,743 | $53,886 | $75,857 |
| 2013 | -- | $105,953 | $41,880 | $64,073 |
Source: Public Records
Map
Nearby Homes
- 2095 S Main St Unit 17
- 2095 S Main St Unit 23
- 1950 S 200 W Unit 32
- 33 W Wicker Ln
- 2943 S 400 W
- 1820 S 440 W
- 553 W 1880 S
- 117 W 3000 S
- 269 E 2200 S
- 2281 S 250 E
- 296 E 2050 S Unit 2
- 320 E 2100 S
- 1602 S 550 W
- 2038 S 350 E Unit 3
- 2008 S 700 W
- 295 E 2050 S Unit 1
- Edgewood A Plan at Oakhaven Park
- Oakhaven Plan at Oakhaven Park
- Fairmont Plan at Oakhaven Park
- Brierwood Plan at Oakhaven Park