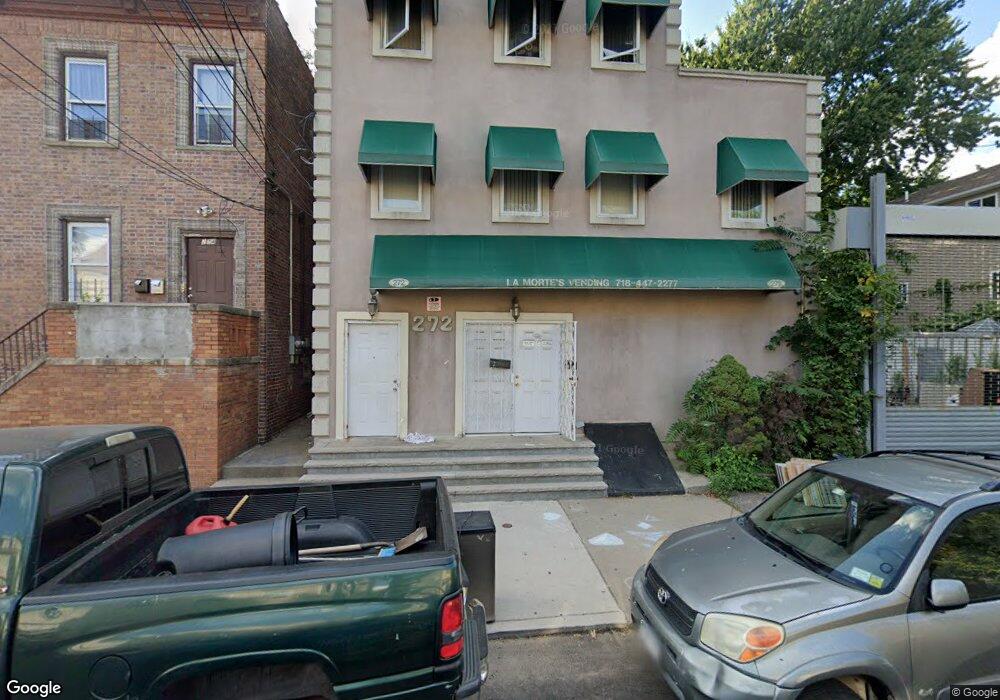
272 York Ave Unit 1st Floor Staten Island, NY 10301
New Brighton NeighborhoodEstimated Value: $650,930
--
Bed
--
Bath
4,280
Sq Ft
$152/Sq Ft
Est. Value
About This Home
This home is located at 272 York Ave Unit 1st Floor, Staten Island, NY 10301 and is currently estimated at $650,930, approximately $152 per square foot. 272 York Ave Unit 1st Floor is a home located in Richmond County with nearby schools including P.S. 31 - William T. Davis, Is 61 William A Morris, and Curtis High School.
Ownership History
Date
Name
Owned For
Owner Type
Purchase Details
Closed on
Oct 29, 2014
Sold by
272 York Avenue Llc
Bought by
Longview County Realty Llc
Current Estimated Value
Purchase Details
Closed on
May 29, 2009
Sold by
Lamorte William and Demaio Anthony
Bought by
272 York Avenue Llc
Purchase Details
Closed on
Jan 27, 2009
Sold by
Adams Christine L and Lamorte Anthony
Bought by
Lamorte Paul
Create a Home Valuation Report for This Property
The Home Valuation Report is an in-depth analysis detailing your home's value as well as a comparison with similar homes in the area
Home Values in the Area
Average Home Value in this Area
Purchase History
| Date | Buyer | Sale Price | Title Company |
|---|---|---|---|
| Longview County Realty Llc | $365,000 | First American Title Ins Co | |
| 272 York Avenue Llc | $399,000 | None Available | |
| Lamorte Paul | -- | None Available |
Source: Public Records
Tax History Compared to Growth
Tax History
| Year | Tax Paid | Tax Assessment Tax Assessment Total Assessment is a certain percentage of the fair market value that is determined by local assessors to be the total taxable value of land and additions on the property. | Land | Improvement |
|---|---|---|---|---|
| 2025 | $21,131 | $206,100 | $56,250 | $149,850 |
| 2024 | $21,131 | $202,950 | $56,250 | $146,700 |
| 2023 | $21,175 | $198,900 | $56,250 | $142,650 |
| 2022 | $20,182 | $187,650 | $56,250 | $131,400 |
| 2021 | $23,566 | $293,850 | $56,250 | $237,600 |
| 2020 | $24,292 | $377,100 | $56,250 | $320,850 |
| 2019 | $24,926 | $352,350 | $56,250 | $296,100 |
| 2018 | $23,224 | $236,700 | $56,250 | $180,450 |
| 2017 | $23,911 | $263,250 | $56,250 | $207,000 |
| 2016 | $23,430 | $259,200 | $56,250 | $202,950 |
| 2015 | $18,358 | $257,400 | $56,250 | $201,150 |
| 2014 | $18,358 | $235,350 | $56,250 | $179,100 |
Source: Public Records
Map
Nearby Homes