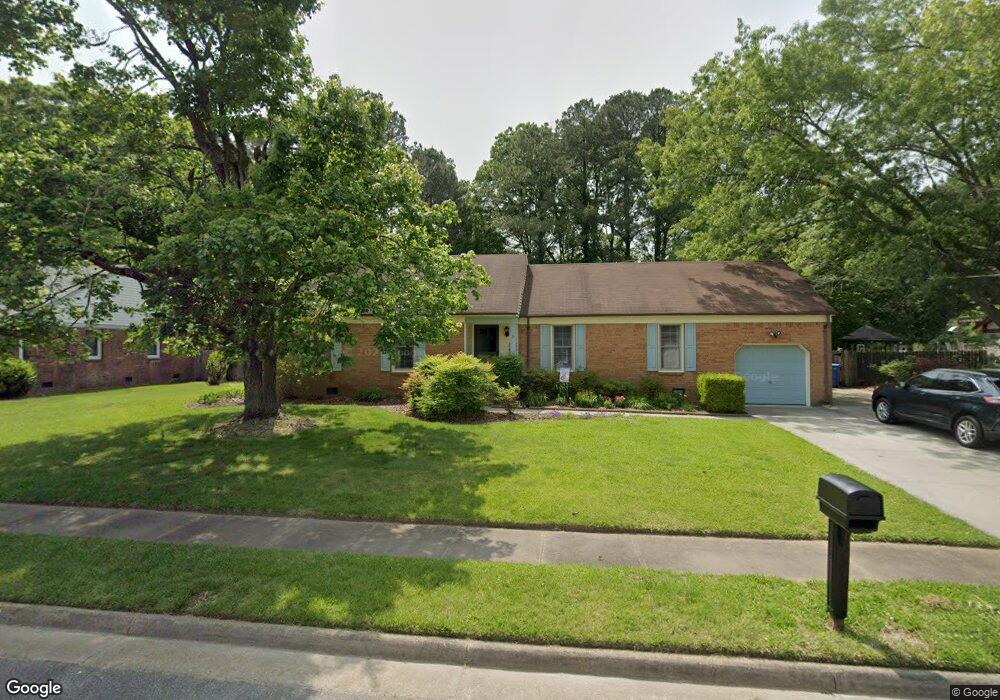
2720 Blacksmith Trail Chesapeake, VA 23322
Pleasant Grove West NeighborhoodEstimated Value: $426,863 - $471,000
3
Beds
2
Baths
1,738
Sq Ft
$263/Sq Ft
Est. Value
About This Home
This home is located at 2720 Blacksmith Trail, Chesapeake, VA 23322 and is currently estimated at $457,716, approximately $263 per square foot. 2720 Blacksmith Trail is a home located in Chesapeake City with nearby schools including Hickory Elementary School, Hickory Middle School, and Grassfield High School.
Ownership History
Date
Name
Owned For
Owner Type
Purchase Details
Closed on
Dec 11, 2017
Sold by
Fitzgerald David R and Fitzgerald Linda A
Bought by
Fitzgerald David R and Fitzgerald Laura A
Current Estimated Value
Home Financials for this Owner
Home Financials are based on the most recent Mortgage that was taken out on this home.
Original Mortgage
$203,500
Outstanding Balance
$171,152
Interest Rate
3.9%
Mortgage Type
New Conventional
Estimated Equity
$286,564
Purchase Details
Closed on
Feb 13, 2006
Sold by
Spann Danny G
Bought by
Fitzgerald David R
Home Financials for this Owner
Home Financials are based on the most recent Mortgage that was taken out on this home.
Original Mortgage
$233,600
Interest Rate
6.15%
Mortgage Type
New Conventional
Purchase Details
Closed on
Nov 3, 2000
Sold by
Gardner David Walter
Bought by
Spann Danny G
Home Financials for this Owner
Home Financials are based on the most recent Mortgage that was taken out on this home.
Original Mortgage
$144,926
Interest Rate
7.7%
Create a Home Valuation Report for This Property
The Home Valuation Report is an in-depth analysis detailing your home's value as well as a comparison with similar homes in the area
Home Values in the Area
Average Home Value in this Area
Purchase History
| Date | Buyer | Sale Price | Title Company |
|---|---|---|---|
| Fitzgerald David R | -- | None Available | |
| Fitzgerald David R | $292,000 | -- | |
| Spann Danny G | $145,000 | -- |
Source: Public Records
Mortgage History
| Date | Status | Borrower | Loan Amount |
|---|---|---|---|
| Open | Fitzgerald David R | $203,500 | |
| Closed | Fitzgerald David R | $233,600 | |
| Previous Owner | Spann Danny G | $144,926 |
Source: Public Records
Tax History
| Year | Tax Paid | Tax Assessment Tax Assessment Total Assessment is a certain percentage of the fair market value that is determined by local assessors to be the total taxable value of land and additions on the property. | Land | Improvement |
|---|---|---|---|---|
| 2025 | $3,805 | $380,900 | $165,000 | $215,900 |
| 2024 | $3,805 | $376,700 | $145,000 | $231,700 |
| 2023 | $3,212 | $344,000 | $115,000 | $229,000 |
| 2022 | $3,304 | $327,100 | $105,000 | $222,100 |
| 2021 | $2,766 | $263,400 | $90,000 | $173,400 |
| 2020 | $2,780 | $264,800 | $90,000 | $174,800 |
| 2019 | $2,708 | $257,900 | $85,000 | $172,900 |
| 2018 | $2,711 | $258,200 | $85,000 | $173,200 |
| 2017 | $2,542 | $242,100 | $85,000 | $157,100 |
| 2016 | $2,490 | $237,100 | $80,000 | $157,100 |
| 2015 | $2,489 | $237,000 | $80,000 | $157,000 |
| 2014 | $2,489 | $237,000 | $80,000 | $157,000 |
Source: Public Records
Map
Nearby Homes
- 2736 Horseshoe Dr
- 2805 Bunch Walnuts Rd
- 2820 Bunch Walnuts Rd
- Lot C Buskey Rd
- Lot D Buskey Rd
- 1361 Jury Rd
- 1409 Paul Eason Dr
- 1153 Benefit Rd
- 1400 Traciene Dr
- MM Racoon (Whitehurst - Homesite 16-1)) Trail
- MM Bellhaven
- 404 Stoney Mist Way
- MM Rd
- MM Kh at Hungarian (Caroline Design) Rd
- 109 Lilypad Ct
- MM Racoon (Kentland Parcel 21 Homesite 2 ) Trail
- 1258 Solitude Trail
- MM Beaver Dam (Whitehurst - Homesite B-1-1) Rd
- 58 Acres West Rd
- MM Riverview Landing (Ashbee
- 2724 Blacksmith Trail
- 2716 Blacksmith Trail
- 2721 Blacksmith Trail
- 2725 Blacksmith Trail
- 2712 Blacksmith Trail
- 2728 Blacksmith Trail
- 2717 Blacksmith Trail
- 2729 Blacksmith Trail
- 2713 Blacksmith Trail
- 2732 Blacksmith Trail
- 2708 Blacksmith Trail
- 2733 Blacksmith Trail
- 2736 Blacksmith Trail
- 2737 Blacksmith Trail
- 2700 Horseshoe Dr
- 2704 Blacksmith Trail
- 2724 Horseshoe Dr
- 2728 Horseshoe Dr
- 2737 Bunch Walnuts Rd
- 2704 Horseshoe Dr
Your Personal Tour Guide
Ask me questions while you tour the home.