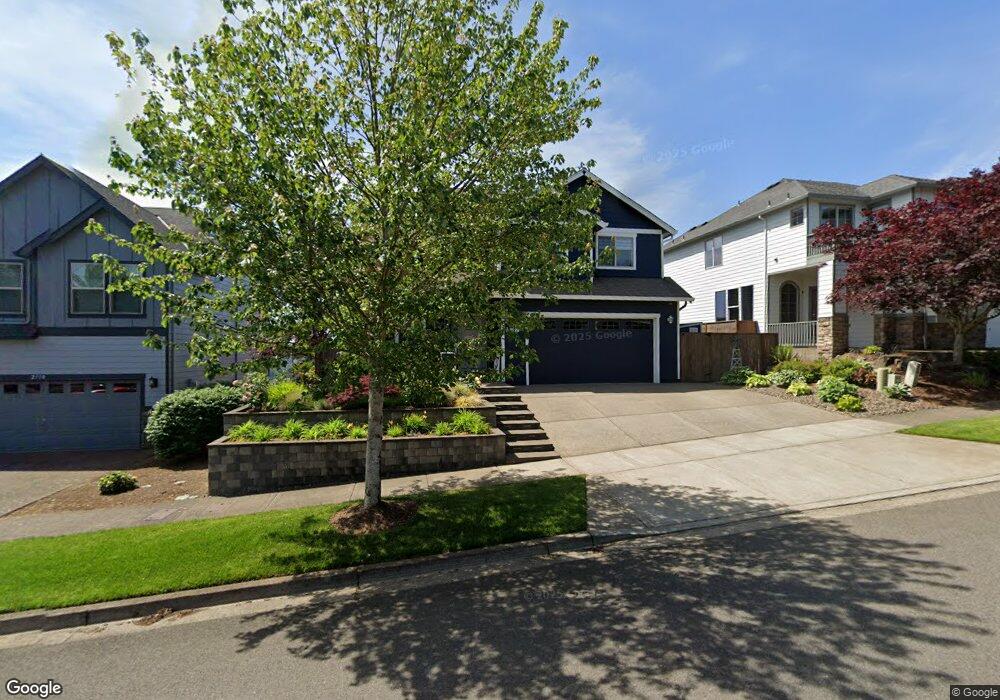
2720 Eagle Eye Ave NW Salem, OR 97304
West Salem NeighborhoodEstimated Value: $595,166 - $649,000
4
Beds
3
Baths
2,452
Sq Ft
$253/Sq Ft
Est. Value
About This Home
This home is located at 2720 Eagle Eye Ave NW, Salem, OR 97304 and is currently estimated at $621,542, approximately $253 per square foot. 2720 Eagle Eye Ave NW is a home located in Polk County with nearby schools including Kalapuya Elementary School, Walker Middle School, and West Salem High School.
Ownership History
Date
Name
Owned For
Owner Type
Purchase Details
Closed on
Jul 7, 2022
Sold by
Freitas Mike and Freitas Beverly
Bought by
Freitas Joint Revocable Living Trust and Freitas
Current Estimated Value
Purchase Details
Closed on
Nov 15, 2019
Sold by
Tingleaf Tobias N and Tingleaf Yvonne E
Bought by
Freitas Mike and Freitas Beverly
Purchase Details
Closed on
Aug 24, 2011
Sold by
Comfort Homes Llc
Bought by
Tingleaf Tobias N and Tingleaf Yvonne E
Home Financials for this Owner
Home Financials are based on the most recent Mortgage that was taken out on this home.
Original Mortgage
$269,952
Interest Rate
4.43%
Mortgage Type
New Conventional
Purchase Details
Closed on
Dec 14, 2009
Sold by
Jls Custom Homes Inc
Bought by
Bank Of America Na
Purchase Details
Closed on
Apr 25, 2007
Sold by
Tran Co
Bought by
Jls Custom Homes Inc
Create a Home Valuation Report for This Property
The Home Valuation Report is an in-depth analysis detailing your home's value as well as a comparison with similar homes in the area
Home Values in the Area
Average Home Value in this Area
Purchase History
| Date | Buyer | Sale Price | Title Company |
|---|---|---|---|
| Freitas Joint Revocable Living Trust | -- | Collier Jacob V | |
| Freitas Mike | $412,000 | First American | |
| Tingleaf Tobias N | $289,952 | Amerititle | |
| Bank Of America Na | $745,996 | Ticor Title | |
| Jls Custom Homes Inc | $660,000 | Ticor Title |
Source: Public Records
Mortgage History
| Date | Status | Borrower | Loan Amount |
|---|---|---|---|
| Previous Owner | Tingleaf Tobias N | $269,952 |
Source: Public Records
Tax History Compared to Growth
Tax History
| Year | Tax Paid | Tax Assessment Tax Assessment Total Assessment is a certain percentage of the fair market value that is determined by local assessors to be the total taxable value of land and additions on the property. | Land | Improvement |
|---|---|---|---|---|
| 2025 | $6,719 | $367,250 | $72,000 | $295,250 |
| 2024 | $6,719 | $356,560 | $69,910 | $286,650 |
| 2023 | $6,524 | $346,180 | $67,870 | $278,310 |
| 2022 | $6,316 | $336,100 | $65,890 | $270,210 |
| 2021 | $6,135 | $326,320 | $63,970 | $262,350 |
| 2020 | $5,953 | $316,820 | $62,110 | $254,710 |
| 2019 | $5,745 | $307,600 | $60,300 | $247,300 |
| 2018 | $5,650 | $298,650 | $58,550 | $240,100 |
| 2017 | $5,092 | $289,960 | $56,850 | $233,110 |
| 2016 | $4,971 | $281,520 | $55,190 | $226,330 |
| 2015 | $5,013 | $273,330 | $53,580 | $219,750 |
| 2014 | $4,774 | $265,370 | $52,020 | $213,350 |
Source: Public Records
Map
Nearby Homes
- 324 Eagles Wing St NW
- 384 Eagles Wing St NW
- 2669 Ojai Dr NW
- 372 Eagle Feather St NW
- 443 Suncrest Ave NW
- 2587 Bandon Ct NW
- 491 Sunwood Dr NW
- 2557 Bandon Ct NW
- 523 Golden Eagle St NW
- 471 Eagle Feather St NW
- 417 Eaglet St NW
- 468 Eaglet St NW
- 2857 Bald Eagle Ave NW
- 2719 Bald Eagle Ave NW
- 616 Golden Eagle St NW
- 368 Stoneway Dr NW
- 539 Eagle View Dr NW
- 559 Eagle Feather St NW
- 1845 Turnage St NW
- 580 Winners Ct NW
- 2720 Eagles Eye Ave NW
- 2730 Eagles Eye Ave NW
- 2730 Eagle Eye Ave NW
- 2710 Eagle Eye Ave NW
- 2740 Eagles Eye Ave NW
- 2740 Eagle Eye Ave NW
- 2725 Eagle Eye Ave NW
- 2735 Eagles Eye Ave NW
- 2735 Eagle Eye Ave NW
- 2715 Eagle Eye Ave NW
- 2750 Eagle Eye Ave NW
- 340 Flying Eagle St NW
- 334 Eagles Wing St NW
- 344 Eagles Wing St NW
- 2760 Eagle Eye Ave NW
- 0 Eagles Eye Ave Unit 621162
- 350 Flying Eagle St NW
- 311 Stellers Eagle St NW
- 303 Stellers Eagle St NW
- 353 Suncrest Ct NW