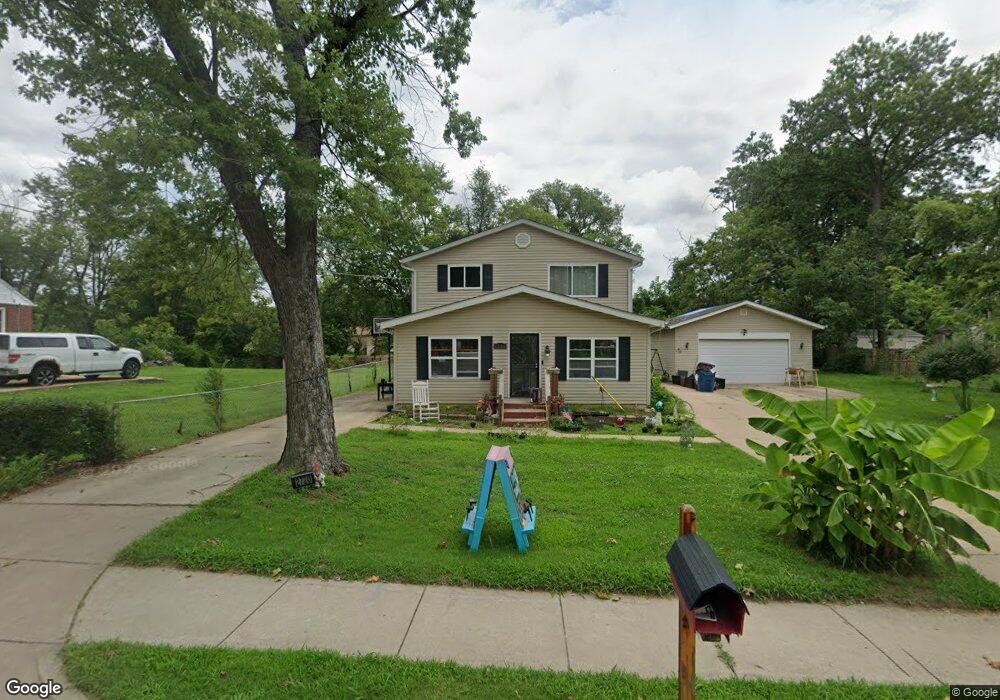
2720 Eldon Ave Maryland Heights, MO 63043
Estimated Value: $283,652 - $345,000
4
Beds
2
Baths
1,976
Sq Ft
$160/Sq Ft
Est. Value
About This Home
This home is located at 2720 Eldon Ave, Maryland Heights, MO 63043 and is currently estimated at $315,413, approximately $159 per square foot. 2720 Eldon Ave is a home located in St. Louis County with nearby schools including Parkwood Elementary, Pattonville Heights Middle School, and Pattonville High School.
Ownership History
Date
Name
Owned For
Owner Type
Purchase Details
Closed on
Dec 15, 2020
Sold by
Baker Patricia
Bought by
Baker Savannah
Current Estimated Value
Purchase Details
Closed on
Dec 14, 2020
Sold by
Liebman Timothy and Liebman Michele
Bought by
Liebman Timothy and Liebman Michele
Purchase Details
Closed on
Aug 17, 2007
Sold by
Baker William E
Bought by
Baker Patricia L
Purchase Details
Closed on
Apr 25, 2007
Sold by
C & G Properties Inc
Bought by
Baker William E
Purchase Details
Closed on
Jan 5, 2005
Sold by
C & G Properties Inc
Bought by
City Of Maryland Heights
Purchase Details
Closed on
Mar 22, 2000
Sold by
City Of Maryland Heights
Bought by
C&G Properties Inc
Purchase Details
Closed on
Feb 29, 2000
Sold by
Weber Joseph B and Weber Sharon E
Bought by
C & G Properties Inc
Create a Home Valuation Report for This Property
The Home Valuation Report is an in-depth analysis detailing your home's value as well as a comparison with similar homes in the area
Home Values in the Area
Average Home Value in this Area
Purchase History
| Date | Buyer | Sale Price | Title Company |
|---|---|---|---|
| Baker Savannah | -- | None Available | |
| Baker Savannah | $1,000 | None Listed On Document | |
| Liebman Timothy | -- | None Available | |
| Baker Patricia L | $45,000 | None Available | |
| Baker William E | $44,500 | None Available | |
| City Of Maryland Heights | $1,664 | -- | |
| C&G Properties Inc | $200 | -- | |
| C & G Properties Inc | $49,900 | -- |
Source: Public Records
Tax History
| Year | Tax Paid | Tax Assessment Tax Assessment Total Assessment is a certain percentage of the fair market value that is determined by local assessors to be the total taxable value of land and additions on the property. | Land | Improvement |
|---|---|---|---|---|
| 2025 | $2,930 | $55,660 | $14,330 | $41,330 |
| 2024 | $2,930 | $38,360 | $11,250 | $27,110 |
| 2023 | $2,930 | $38,360 | $11,250 | $27,110 |
| 2022 | $3,208 | $38,190 | $13,320 | $24,870 |
| 2021 | $3,240 | $38,190 | $13,320 | $24,870 |
| 2020 | $2,386 | $28,270 | $11,020 | $17,250 |
| 2019 | $2,378 | $28,270 | $11,020 | $17,250 |
| 2018 | $1,907 | $20,660 | $3,880 | $16,780 |
| 2017 | $1,905 | $20,660 | $3,880 | $16,780 |
| 2016 | $1,877 | $19,980 | $6,760 | $13,220 |
| 2015 | $1,859 | $19,980 | $6,760 | $13,220 |
| 2014 | $1,796 | $19,630 | $5,970 | $13,660 |
Source: Public Records
Map
Nearby Homes
- 2727 Edgeworth Ave
- 2801 Eldon Ave
- 20 Millwell Dr
- 25 Delord Ave
- 41 Millwell Dr
- 2844 Sugar Tree Ln
- 11945 Longmont Dr
- 27 Lennox Terrace
- 11828 Foxwood Dr
- 3051 Charmbrook Ln
- 19 Shumate Ave
- 316 Harding Ave
- 11959 Brookmont Dr
- 11846 Sologne Ct Unit 39B
- 2430 Charente Dr
- 2417 Charente Dr Unit 65A
- 11863 Charlemagne Dr
- 2364 Charlemagne Dr Unit A
- 3107 Garnette Dr Unit B1
- 3107 Garnette Dr Unit A7
- 2730 Eldon Ave
- 717 Midland Ave
- 2717 Eldon Ave
- 2740 Eldon Ave
- 2729 Eldon Ave
- 2707 Edgeworth Ave
- 2711 Eldon Ave
- 2749 Eldon Ave
- 2711 Edgeworth Ave
- 2756 Eldon Ave
- 11808 Wexford Place Dr
- 2715 Edgeworth Ave
- 2706 Lakeport Dr
- 1TBB Maple @ Magnolia Gardens Ave
- 11812 Wexford Place Dr
- 2739 Eldon Ave
- 2760 Eldon Ave
- 2719 Edgeworth Ave
- 610 Midland Ave
- 614 Midland Ave
Your Personal Tour Guide
Ask me questions while you tour the home.