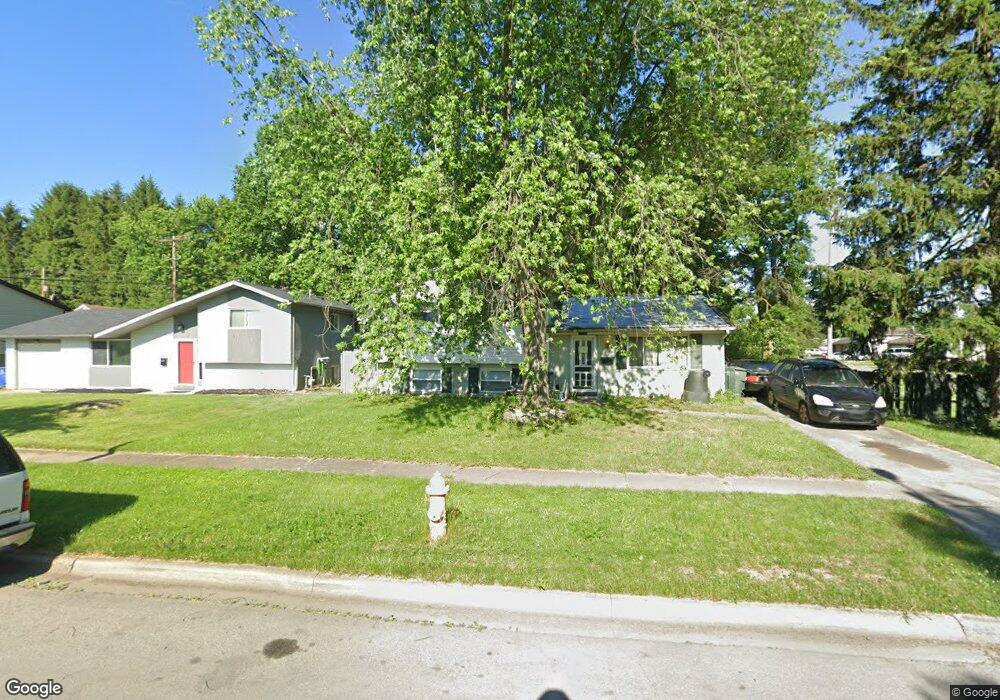
2720 Maywood Rd Columbus, OH 43232
Walnut Heights NeighborhoodEstimated Value: $188,000 - $254,295
3
Beds
2
Baths
1,405
Sq Ft
$163/Sq Ft
Est. Value
About This Home
This home is located at 2720 Maywood Rd, Columbus, OH 43232 and is currently estimated at $228,824, approximately $162 per square foot. 2720 Maywood Rd is a home located in Franklin County with nearby schools including Liberty Elementary School, Yorktown Middle School, and Independence High School.
Ownership History
Date
Name
Owned For
Owner Type
Purchase Details
Closed on
Oct 31, 2008
Sold by
Cummings Mark and Cummings Dana
Bought by
Taylor Smith Leslie F
Current Estimated Value
Home Financials for this Owner
Home Financials are based on the most recent Mortgage that was taken out on this home.
Original Mortgage
$77,272
Outstanding Balance
$49,838
Interest Rate
5.73%
Mortgage Type
FHA
Estimated Equity
$178,986
Purchase Details
Closed on
Apr 29, 2002
Sold by
Cummings Dana R and The Harry S Crews Revocable Li
Bought by
Cummings Dana R
Purchase Details
Closed on
Aug 12, 1998
Sold by
Clark Steven A and Clark Kelly J
Bought by
Cummings Mark and Cummings Dana
Home Financials for this Owner
Home Financials are based on the most recent Mortgage that was taken out on this home.
Original Mortgage
$82,800
Interest Rate
10.25%
Purchase Details
Closed on
Aug 1, 1988
Purchase Details
Closed on
Jan 1, 1987
Create a Home Valuation Report for This Property
The Home Valuation Report is an in-depth analysis detailing your home's value as well as a comparison with similar homes in the area
Home Values in the Area
Average Home Value in this Area
Purchase History
| Date | Buyer | Sale Price | Title Company |
|---|---|---|---|
| Taylor Smith Leslie F | $78,100 | Preferred T | |
| Cummings Dana R | -- | -- | |
| Cummings Mark | $92,000 | Ohio Land Title Agency Inc | |
| -- | $60,100 | -- | |
| -- | -- | -- |
Source: Public Records
Mortgage History
| Date | Status | Borrower | Loan Amount |
|---|---|---|---|
| Open | Taylor Smith Leslie F | $77,272 | |
| Previous Owner | Cummings Mark | $82,800 |
Source: Public Records
Tax History Compared to Growth
Tax History
| Year | Tax Paid | Tax Assessment Tax Assessment Total Assessment is a certain percentage of the fair market value that is determined by local assessors to be the total taxable value of land and additions on the property. | Land | Improvement |
|---|---|---|---|---|
| 2024 | $3,139 | $69,940 | $21,390 | $48,550 |
| 2023 | $3,099 | $69,930 | $21,385 | $48,545 |
| 2022 | $2,171 | $41,860 | $10,710 | $31,150 |
| 2021 | $2,175 | $41,860 | $10,710 | $31,150 |
| 2020 | $2,152 | $41,370 | $10,710 | $30,660 |
| 2019 | $2,053 | $33,850 | $8,930 | $24,920 |
| 2018 | $1,813 | $33,360 | $8,930 | $24,430 |
| 2017 | $2,023 | $33,360 | $8,930 | $24,430 |
| 2016 | $1,769 | $26,710 | $5,880 | $20,830 |
| 2015 | $1,606 | $26,710 | $5,880 | $20,830 |
| 2014 | $1,610 | $26,710 | $5,880 | $20,830 |
| 2013 | $883 | $29,680 | $6,545 | $23,135 |
Source: Public Records
Map
Nearby Homes
- 2706 Maywood Rd
- 5011 Refugee Rd
- 2615 Carbondale Place
- 5137 Holbrook Dr
- 2705 Denmark Rd
- 5061 Labelle Dr
- 2746 Noe Bixby Rd
- 2900 Ronda Rd
- 2150 Noe Bixby Rd
- 5114 Carbondale Dr
- 2651 Brownfield Rd
- 2998 Osgood Rd E
- 5123 Jameson Dr
- 5268 Carbondale Dr
- 5373 Spire Ln
- 5143 Rutledge Dr N
- 5401 Spire Ln
- 5326 Adderley Ave
- 3067 Argonne Ct
- 5377 Bleaker Ave
- 4980 Refugee Rd
- 2696 Maywood Rd
- 2719 Maywood Rd
- 2740 Maywood Rd
- 4969 Refugee Rd
- 2688 Maywood Rd
- 4977 Refugee Rd
- 4936 Refugee Rd
- 2691 Maywood Rd
- 2735 Maywood Rd
- 4985 Refugee Rd
- 2682 Maywood Rd
- 4945 Downing Dr
- 4930 Refugee Rd
- 4933 Refugee Rd
- 4993 Refugee Rd
- 4980 Cryodon Blvd N
- 4988 Cryodon Blvd N
- 2752 Maywood Rd
- 4939 Downing Dr