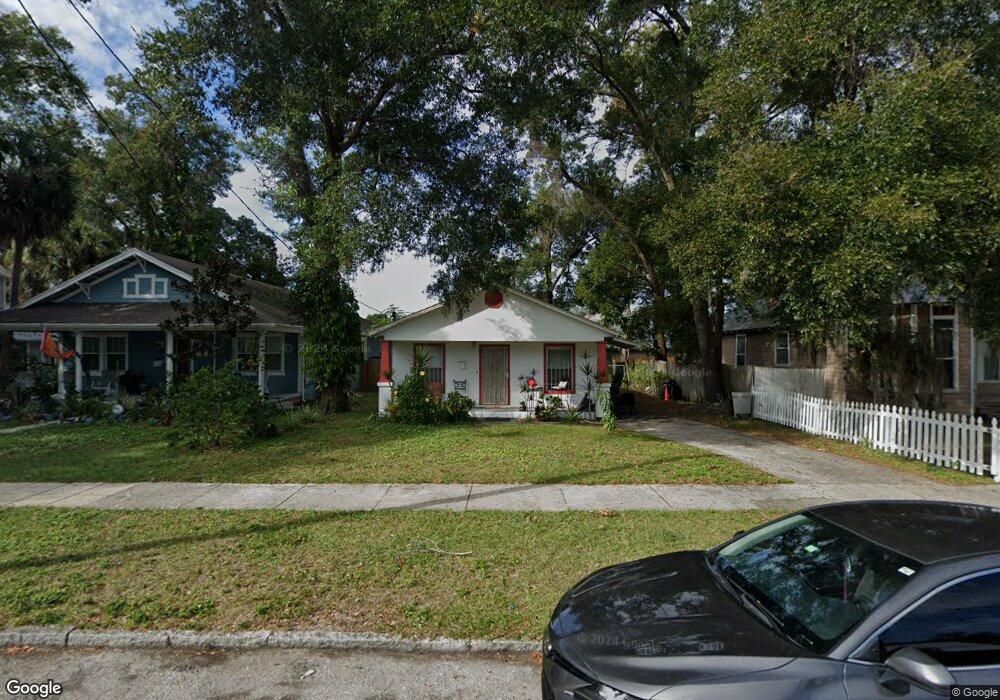
2720 N Morgan St Tampa, FL 33602
Tampa Heights NeighborhoodEstimated Value: $371,000 - $441,000
3
Beds
2
Baths
1,104
Sq Ft
$359/Sq Ft
Est. Value
About This Home
This home is located at 2720 N Morgan St, Tampa, FL 33602 and is currently estimated at $396,335, approximately $358 per square foot. 2720 N Morgan St is a home located in Hillsborough County with nearby schools including Graham Elementary School, Stewart Middle Magnet School, and Hillsborough High School.
Ownership History
Date
Name
Owned For
Owner Type
Purchase Details
Closed on
Dec 6, 2007
Sold by
Brown Solomon and Brown Elaine D
Bought by
Brown Solomon
Current Estimated Value
Home Financials for this Owner
Home Financials are based on the most recent Mortgage that was taken out on this home.
Original Mortgage
$232,500
Outstanding Balance
$132,939
Interest Rate
4.5%
Mortgage Type
Reverse Mortgage Home Equity Conversion Mortgage
Estimated Equity
$263,396
Purchase Details
Closed on
Dec 18, 2002
Sold by
Brown Solomon
Bought by
Brown Solomon and Brown Elaine D
Home Financials for this Owner
Home Financials are based on the most recent Mortgage that was taken out on this home.
Original Mortgage
$81,900
Interest Rate
6.1%
Purchase Details
Closed on
Jun 14, 1993
Sold by
Tampa United Methodist Centers Inc
Bought by
Brown Solomon
Home Financials for this Owner
Home Financials are based on the most recent Mortgage that was taken out on this home.
Original Mortgage
$58,570
Interest Rate
7.45%
Create a Home Valuation Report for This Property
The Home Valuation Report is an in-depth analysis detailing your home's value as well as a comparison with similar homes in the area
Home Values in the Area
Average Home Value in this Area
Purchase History
| Date | Buyer | Sale Price | Title Company |
|---|---|---|---|
| Brown Solomon | $31,700 | Beach To Bay Title Inc | |
| Brown Solomon | -- | Majestic Title Of Central Fl | |
| Brown Solomon | $57,900 | -- |
Source: Public Records
Mortgage History
| Date | Status | Borrower | Loan Amount |
|---|---|---|---|
| Open | Brown Solomon | $232,500 | |
| Closed | Brown Solomon | $81,900 | |
| Closed | Brown Solomon | $58,570 |
Source: Public Records
Tax History Compared to Growth
Tax History
| Year | Tax Paid | Tax Assessment Tax Assessment Total Assessment is a certain percentage of the fair market value that is determined by local assessors to be the total taxable value of land and additions on the property. | Land | Improvement |
|---|---|---|---|---|
| 2024 | $530 | $47,321 | -- | -- |
| 2023 | $507 | $45,943 | $0 | $0 |
| 2022 | $483 | $44,605 | $0 | $0 |
| 2021 | $466 | $43,306 | $0 | $0 |
| 2020 | $452 | $42,708 | $0 | $0 |
| 2019 | $429 | $41,748 | $0 | $0 |
| 2018 | $412 | $40,970 | $0 | $0 |
| 2017 | $393 | $92,141 | $0 | $0 |
| 2016 | $370 | $39,302 | $0 | $0 |
| 2015 | $342 | $39,029 | $0 | $0 |
| 2014 | $309 | $38,719 | $0 | $0 |
| 2013 | -- | $38,147 | $0 | $0 |
Source: Public Records
Map
Nearby Homes
- 2801 N Jefferson St
- 2810 N Jefferson St
- 120 E Gladys St Unit 4
- 2820 N Central Ct
- 2902 N Jefferson St
- 2810 N Florida Ave
- 2821 N Morgan St
- 408 E Amelia Ave
- 412 E Amelia Ave
- 2801 N Tampa St
- 501 E Sparkman Ave
- 2911 N Jefferson St
- 101 W Warren Ave Unit 1
- 2819 N Central Ave
- 2708 N Elmore Ave
- 2806 N Tampa St
- 502 E Robles St
- 105 W Columbus Dr
- 510 E Robles St
- 107 W Amelia Ave
- 2722 N Morgan St
- 2718 N Morgan St
- 209 E Gladys St
- 2716 N Morgan St
- 2802 N Morgan St
- 2723 N Morgan St
- 210 E Gladys St
- 2721 N Morgan St
- 101 E Gladys St
- 2714 N Morgan St Unit 12
- 2714 N Morgan St
- 2717 N Morgan St
- 2801 N Morgan St
- 2806 N Morgan St
- 2715 N Morgan St
- 2803 N Morgan St
- 2712 N Morgan St
- 2801 N Florida Ave
- 2713 N Morgan St
- 2808 N Morgan St