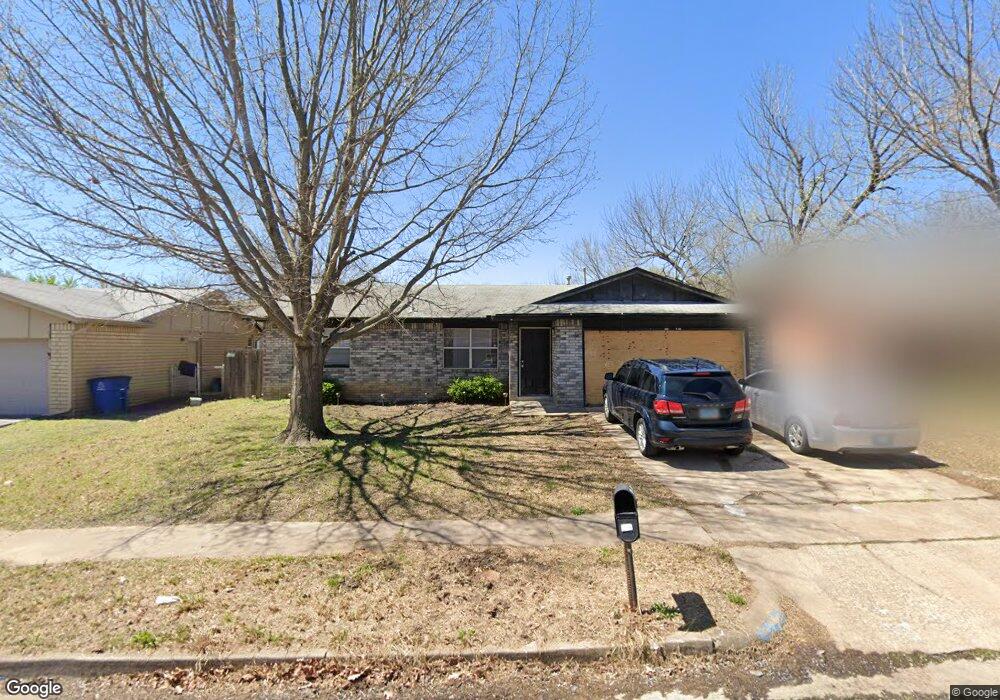
2720 S 136th East Place Tulsa, OK 74134
Eastpark NeighborhoodEstimated Value: $164,000 - $195,000
--
Bed
2
Baths
1,296
Sq Ft
$133/Sq Ft
Est. Value
About This Home
This home is located at 2720 S 136th East Place, Tulsa, OK 74134 and is currently estimated at $172,612, approximately $133 per square foot. 2720 S 136th East Place is a home located in Tulsa County with nearby schools including Disney Elementary School, East Central High School, and Dove Science Academy Tulsa.
Ownership History
Date
Name
Owned For
Owner Type
Purchase Details
Closed on
Jul 19, 2025
Sold by
Wood Brittney D and Wood Kyle Andrew
Bought by
Sfr Owner I Llc
Current Estimated Value
Purchase Details
Closed on
Apr 19, 2023
Sold by
American Money Properties Llc
Bought by
Wood Brittney D and Wood Kyle Andrew
Home Financials for this Owner
Home Financials are based on the most recent Mortgage that was taken out on this home.
Original Mortgage
$162,011
Interest Rate
6.35%
Mortgage Type
FHA
Purchase Details
Closed on
Oct 20, 2022
Sold by
Local Guys Buy Houses Llc
Bought by
American Money Properties Llc
Purchase Details
Closed on
Oct 19, 2022
Sold by
Sutton Ashley
Bought by
Local Guys Buy Houses Llc
Purchase Details
Closed on
Jun 10, 2005
Sold by
Swofford Gary G and Swofford Rhonda
Bought by
Engles Barbara J
Create a Home Valuation Report for This Property
The Home Valuation Report is an in-depth analysis detailing your home's value as well as a comparison with similar homes in the area
Home Values in the Area
Average Home Value in this Area
Purchase History
| Date | Buyer | Sale Price | Title Company |
|---|---|---|---|
| Sfr Owner I Llc | $164,000 | American Eagle | |
| Wood Brittney D | $165,000 | Firstitle | |
| American Money Properties Llc | $103,000 | -- | |
| Local Guys Buy Houses Llc | $100,000 | Chicago Title | |
| Engles Barbara J | $82,000 | First American Title & Abstr |
Source: Public Records
Mortgage History
| Date | Status | Borrower | Loan Amount |
|---|---|---|---|
| Previous Owner | Wood Brittney D | $5,670 | |
| Previous Owner | Wood Brittney D | $162,011 |
Source: Public Records
Tax History Compared to Growth
Tax History
| Year | Tax Paid | Tax Assessment Tax Assessment Total Assessment is a certain percentage of the fair market value that is determined by local assessors to be the total taxable value of land and additions on the property. | Land | Improvement |
|---|---|---|---|---|
| 2024 | $2,020 | $16,161 | $2,206 | $13,955 |
| 2023 | $2,020 | $15,917 | $2,343 | $13,574 |
| 2022 | $1,372 | $10,288 | $2,050 | $8,238 |
| 2021 | $1,294 | $9,799 | $1,953 | $7,846 |
| 2020 | $1,277 | $9,799 | $1,953 | $7,846 |
| 2019 | $1,343 | $9,799 | $1,953 | $7,846 |
| 2018 | $1,314 | $9,564 | $1,906 | $7,658 |
| 2017 | $1,249 | $9,108 | $1,815 | $7,293 |
| 2016 | $1,223 | $9,108 | $1,815 | $7,293 |
| 2015 | $1,225 | $9,108 | $1,815 | $7,293 |
| 2014 | $1,213 | $9,108 | $1,815 | $7,293 |
Source: Public Records
Map
Nearby Homes
- 2761 S 134th East Ave
- 13053 E 28th Place
- 13059 E 28th Place
- 2809 S 140th Ave E
- 3017 S 136th East Ave Unit A
- 13019 E 27th Place
- 14127 E 24th Place
- 12906 E 25th St
- 13508 E 31st Place
- 14841 E 32nd St S
- 3249 S 138th East Ave
- 13801 E 33rd Place
- 2804 S 125th East Ave
- 12520 E 25th St
- 13321 E 33rd Place
- 13802 E 19th Place
- 12802 E 31st Ct
- 12634 E 31st Place
- 3363 S 137th East Ave
- 3352 S 138th East Ave
- 2720 S 136th Place E
- 2724 S 136th East Place
- 2714 S 136th East Place
- 2717 S 136th East Ave
- 2721 S 136th East Ave
- 2711 S 136th East Ave
- 2728 S 136th East Place
- 2706 S 136th East Place
- 2719 S 136th Place E
- 2719 S 136th East Place
- 2725 S 136th East Ave
- 2707 S 136th East Ave
- 2715 S 136th East Place
- 2723 S 136th East Place
- 2734 S 136th East Place
- 2702 S 136th East Place
- 2727 S 136th East Place
- 2705 S 136th East Place
- 2731 S 136th East Ave
- 2703 S 136th East Ave