2720 SW 12th Ave Unit 66 Cape Coral, FL 33914
Pelican NeighborhoodEstimated Value: $271,000 - $370,000
3
Beds
2
Baths
1,295
Sq Ft
$240/Sq Ft
Est. Value
About This Home
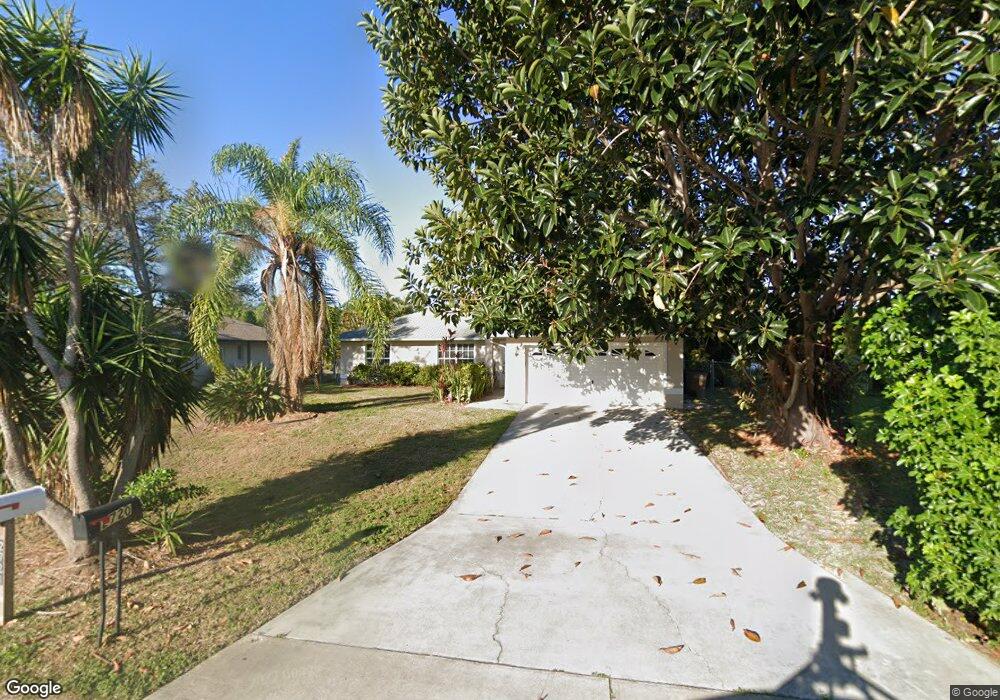
This home is located at 2720 SW 12th Ave Unit 66, Cape Coral, FL 33914 and is currently estimated at $311,410, approximately $240 per square foot. 2720 SW 12th Ave Unit 66 is a home located in Lee County with nearby schools including Cape Elementary School, Caloosa Elementary School, and Tropic Isles Elementary School.
Ownership History
Date
Name
Owned For
Owner Type
Purchase Details
Closed on
Jun 25, 2015
Sold by
Ih2 Property Florida Lp
Bought by
2015 & 3 Ih2 Borrower Lp
Current Estimated Value
Purchase Details
Closed on
Jun 7, 2013
Sold by
Zarbafi Mary Anne
Bought by
Ih2 Property Florida Lp
Purchase Details
Closed on
Jun 27, 2011
Sold by
Middleton April and Middleton Gloria
Bought by
Zarbafi Mary Anne
Purchase Details
Closed on
Sep 28, 2001
Sold by
Strauss Christine
Bought by
Middleton April and Middleton Gloria
Purchase Details
Closed on
Mar 28, 1997
Sold by
Mastercraft Homes Inc
Bought by
Strauss Christine
Home Financials for this Owner
Home Financials are based on the most recent Mortgage that was taken out on this home.
Original Mortgage
$76,500
Interest Rate
7.69%
Create a Home Valuation Report for This Property
The Home Valuation Report is an in-depth analysis detailing your home's value as well as a comparison with similar homes in the area
Home Values in the Area
Average Home Value in this Area
Purchase History
| Date | Buyer | Sale Price | Title Company |
|---|---|---|---|
| 2015 & 3 Ih2 Borrower Lp | -- | None Available | |
| Ih2 Property Florida Lp | $150,000 | North American Title Company | |
| Zarbafi Mary Anne | $120,000 | Title Professionals Of Fl | |
| Middleton April | $125,000 | -- | |
| Strauss Christine | $103,500 | -- |
Source: Public Records
Mortgage History
| Date | Status | Borrower | Loan Amount |
|---|---|---|---|
| Previous Owner | Strauss Christine | $76,500 |
Source: Public Records
Tax History Compared to Growth
Tax History
| Year | Tax Paid | Tax Assessment Tax Assessment Total Assessment is a certain percentage of the fair market value that is determined by local assessors to be the total taxable value of land and additions on the property. | Land | Improvement |
|---|---|---|---|---|
| 2025 | $5,625 | $245,075 | $69,445 | $149,861 |
| 2024 | $5,695 | $223,093 | $63,062 | $125,521 |
| 2023 | $5,695 | $223,549 | $0 | $0 |
| 2022 | $5,573 | $203,226 | $0 | $0 |
| 2021 | $5,155 | $184,866 | $32,445 | $152,421 |
| 2020 | $4,916 | $167,955 | $26,200 | $141,755 |
| 2019 | $4,729 | $159,877 | $44,600 | $115,277 |
| 2018 | $4,819 | $161,502 | $42,500 | $119,002 |
| 2017 | $4,711 | $152,619 | $16,000 | $136,619 |
| 2016 | $4,567 | $140,133 | $19,903 | $120,230 |
| 2015 | $4,374 | $128,196 | $14,954 | $113,242 |
| 2014 | $4,159 | $116,394 | $10,324 | $106,070 |
| 2013 | -- | $98,402 | $7,458 | $90,944 |
Source: Public Records
Map
Nearby Homes
- 2713 SW 12th Place
- 926 SW 28th St
- 836 SW 28th St
- 1223 SW 28th Terrace
- 1521 SW 28th Terrace Unit 5
- 239 SW 28th Terrace
- 1231 SW 28th Terrace
- 2720 SW 11th Ave
- 2733 SW 11th Ave
- 1132 SW 29th St
- 2628 SW 10th Ave
- 930 SW 28th St
- 2535 SW 11th Ave
- 1214 SW 29th Terrace
- 1426 SW 28th St
- 2718 SW 9th Place
- 1502 SW 28th St
- 2933 SW 11th Place
- 2526 SW 10th Ave Unit 66
- 1121 SW 25th St
- 2720 SW 12th Ave
- 2724 SW 12th Ave
- 2716 SW 12th Ave
- 2721 SW 12th Place
- 2717 SW 12th Place
- 2725 SW 12th Place
- 2712 SW 12th Ave Unit 66
- 2728 SW 12th Ave
- 2721 SW 12th Ave
- 2729 SW 12th Place
- 2708 SW 12th Ave
- 2729 SW 12th Ave
- 2732 SW 12th Ave
- 2714 SW 12th Ave
- 2713 SW 12th Ave
- 2709 SW 12th Place
- 2709 SW 12th Ave
- 2733 SW 12th Ave
- 2720 SW 11th Ct
- 2720 SW 12th Place