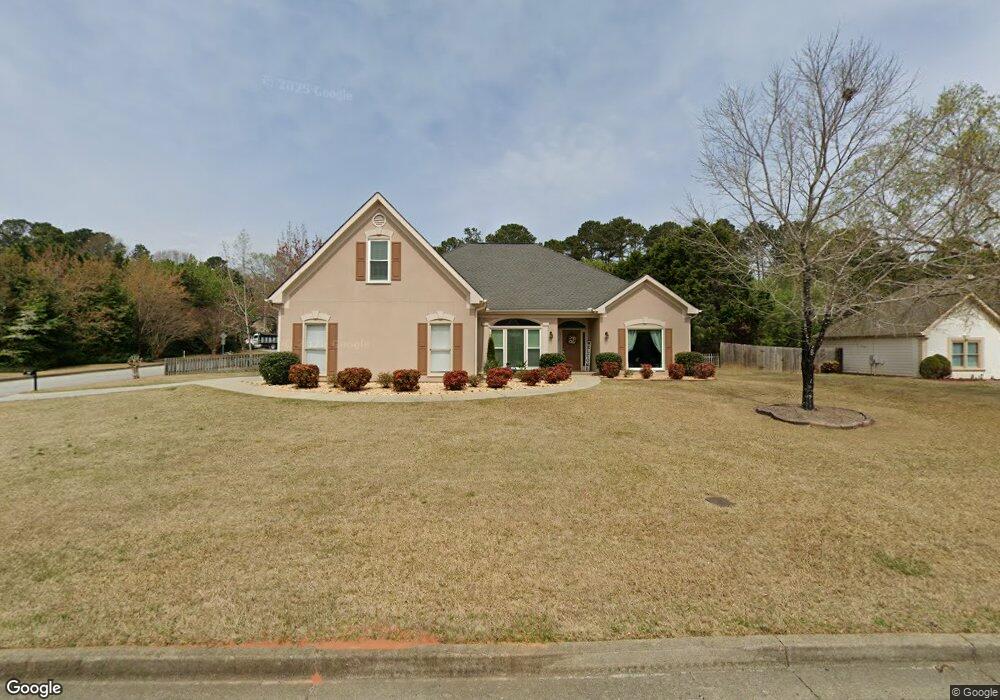
2720 Tribble Gates Dr Loganville, GA 30052
Estimated Value: $394,059 - $420,000
3
Beds
3
Baths
2,553
Sq Ft
$158/Sq Ft
Est. Value
About This Home
This home is located at 2720 Tribble Gates Dr, Loganville, GA 30052 and is currently estimated at $402,515, approximately $157 per square foot. 2720 Tribble Gates Dr is a home located in Gwinnett County with nearby schools including W.J. Cooper Elementary School, McConnell Middle School, and Archer High School.
Ownership History
Date
Name
Owned For
Owner Type
Purchase Details
Closed on
Oct 28, 2021
Sold by
Chupp Terry W
Bought by
Taylor Steven C and Taylor Linda F
Current Estimated Value
Purchase Details
Closed on
Dec 7, 2016
Sold by
Cottonwood Builders Inc
Bought by
Chupp Terry W
Purchase Details
Closed on
Dec 23, 1997
Sold by
Cottonwood Builders Inc
Bought by
Chupp Terry W and Chupp Gloria S
Home Financials for this Owner
Home Financials are based on the most recent Mortgage that was taken out on this home.
Original Mortgage
$126,900
Interest Rate
7.2%
Mortgage Type
New Conventional
Create a Home Valuation Report for This Property
The Home Valuation Report is an in-depth analysis detailing your home's value as well as a comparison with similar homes in the area
Home Values in the Area
Average Home Value in this Area
Purchase History
| Date | Buyer | Sale Price | Title Company |
|---|---|---|---|
| Taylor Steven C | $287,000 | -- | |
| Chupp Terry W | -- | -- | |
| Chupp Terry W | $149,300 | -- |
Source: Public Records
Mortgage History
| Date | Status | Borrower | Loan Amount |
|---|---|---|---|
| Previous Owner | Chupp Terry W | $126,900 |
Source: Public Records
Tax History Compared to Growth
Tax History
| Year | Tax Paid | Tax Assessment Tax Assessment Total Assessment is a certain percentage of the fair market value that is determined by local assessors to be the total taxable value of land and additions on the property. | Land | Improvement |
|---|---|---|---|---|
| 2024 | $1,809 | $154,680 | $24,000 | $130,680 |
| 2023 | $1,809 | $153,480 | $28,000 | $125,480 |
| 2022 | $1,771 | $114,800 | $24,000 | $90,800 |
| 2021 | $1,223 | $103,320 | $20,400 | $82,920 |
| 2020 | $1,220 | $103,320 | $20,400 | $82,920 |
| 2019 | $1,133 | $96,440 | $18,800 | $77,640 |
| 2018 | $1,114 | $83,480 | $12,800 | $70,680 |
| 2016 | $1,148 | $76,000 | $12,800 | $63,200 |
| 2015 | $1,166 | $76,000 | $12,800 | $63,200 |
| 2014 | $1,165 | $66,400 | $10,800 | $55,600 |
Source: Public Records
Map
Nearby Homes
- 3152 Parks Run
- 3145 Parks Run
- 620 Tribble Way
- 2958 Mary Alice Trail
- 775 Tribble Cove Dr Unit III
- 2345 Dixon Place
- 770 Marlin Dr
- 2385 Dixon Place
- 760 Marlin Dr
- 2405 Dixon Place
- 2365 Dixon Place
- 780 Marlin Dr
- 2325 Dixon Place
- 2485 Dixon Place
- Ansley Plan at Hamilton Lakes
- Wynwood Plan at Hamilton Lakes
- Lassiter Plan at Hamilton Lakes
- 3142 Parks Run
- 3112 Parks Run
- 2700 Tribble Gates Dr
- 3135 Parks Run
- 3125 Parks Run
- 3102 Parks Run
- 3162 Parks Run
- 2705 Tribble Gates Dr
- 3095 Parks Run Unit 1
- 2680 Tribble Gates Dr
- 3068 Mary Alice Trail
- 3085 Parks Run
- 3172 Parks Run
- 2670 Tribble Gates Dr
- 2695 Tribble Gates Dr Unit 1
- 3048 Mary Alice Trail Unit 2
- 2692 Tribble Cir Unit 1
- 675 Tribble Gates Ct
- 0 Tribble Gates Dr Unit 8622673
- 0 Tribble Gates Dr Unit 8637799