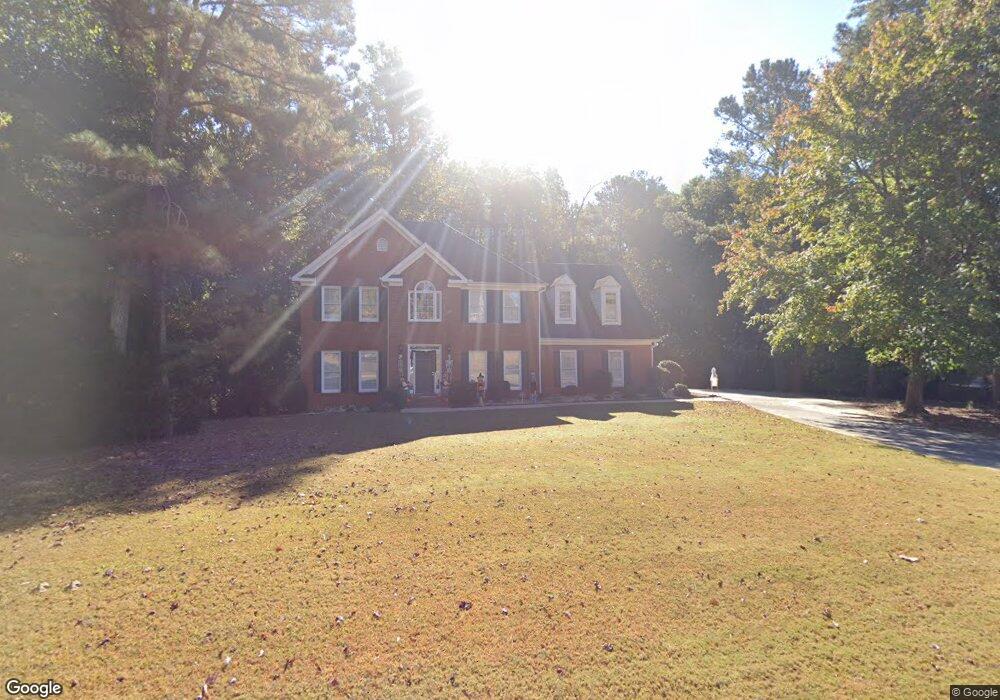
2720 Wellington Way SE Unit 2 Conyers, GA 30013
Estimated Value: $425,000 - $584,000
4
Beds
4
Baths
3,034
Sq Ft
$164/Sq Ft
Est. Value
About This Home
This home is located at 2720 Wellington Way SE Unit 2, Conyers, GA 30013 and is currently estimated at $496,283, approximately $163 per square foot. 2720 Wellington Way SE Unit 2 is a home located in Rockdale County with nearby schools including Flat Shoals Elementary School, Memorial Middle School, and Salem High School.
Ownership History
Date
Name
Owned For
Owner Type
Purchase Details
Closed on
Dec 21, 2023
Sold by
Nelson Rodney
Bought by
Nelson Karen Tr and Nelson Rodney Tr
Current Estimated Value
Purchase Details
Closed on
Jan 6, 2006
Sold by
Payne Gary R and Payne Cathy P
Bought by
Nelson Rodney
Home Financials for this Owner
Home Financials are based on the most recent Mortgage that was taken out on this home.
Original Mortgage
$301,500
Interest Rate
8.4%
Mortgage Type
New Conventional
Purchase Details
Closed on
Oct 21, 2002
Sold by
Payne Gary R and Payne Cathy P
Bought by
Payne Gary R and Payne Cathy P
Home Financials for this Owner
Home Financials are based on the most recent Mortgage that was taken out on this home.
Original Mortgage
$145,850
Interest Rate
6.21%
Mortgage Type
New Conventional
Purchase Details
Closed on
Dec 15, 1993
Sold by
Falcon Devel Inc
Bought by
Payne Gary Randall and Payne Cathy P
Create a Home Valuation Report for This Property
The Home Valuation Report is an in-depth analysis detailing your home's value as well as a comparison with similar homes in the area
Home Values in the Area
Average Home Value in this Area
Purchase History
| Date | Buyer | Sale Price | Title Company |
|---|---|---|---|
| Nelson Karen Tr | -- | -- | |
| Nelson Rodney | $335,000 | -- | |
| Payne Gary R | -- | -- | |
| Payne Gary Randall | $241,900 | -- |
Source: Public Records
Mortgage History
| Date | Status | Borrower | Loan Amount |
|---|---|---|---|
| Previous Owner | Nelson Rodney | $301,500 | |
| Previous Owner | Payne Gary R | $145,850 | |
| Closed | Payne Gary Randall | $0 |
Source: Public Records
Tax History Compared to Growth
Tax History
| Year | Tax Paid | Tax Assessment Tax Assessment Total Assessment is a certain percentage of the fair market value that is determined by local assessors to be the total taxable value of land and additions on the property. | Land | Improvement |
|---|---|---|---|---|
| 2024 | $4,972 | $197,080 | $37,800 | $159,280 |
| 2023 | $3,963 | $164,200 | $34,920 | $129,280 |
| 2022 | $3,784 | $157,240 | $34,920 | $122,320 |
| 2021 | $3,282 | $129,040 | $24,080 | $104,960 |
| 2020 | $3,339 | $125,680 | $24,560 | $101,120 |
| 2019 | $2,832 | $106,480 | $15,000 | $91,480 |
| 2018 | $2,850 | $106,480 | $15,000 | $91,480 |
| 2017 | $4,739 | $103,720 | $15,000 | $88,720 |
| 2016 | $4,173 | $91,280 | $15,880 | $75,400 |
| 2015 | $4,177 | $91,280 | $15,880 | $75,400 |
| 2014 | $4,107 | $88,800 | $13,400 | $75,400 |
| 2013 | -- | $110,360 | $24,000 | $86,360 |
Source: Public Records
Map
Nearby Homes
- 2791 Wellington Way SE Unit 1
- 3095 Brombley Dr SE
- 2052 Evergreen Dr SE
- 2561 Old Salem Cir SE
- 3111 Green Gate Way SE
- 2365 Brentmoore Point Unit 3
- 2405 Old Salem Rd SE Unit 1
- 1260 Sweet Shrub Ln SE
- 2585 Westchester Way SE
- 1180 Azalea Cir SE
- 1613 Brolington Ct
- 1613 Brentwood Crossing SE Unit 3
- 2303 Deerfield Chase SE Unit 5
- 3639 Cape Ln
- 2638 Westchester Pkwy SE
- 3226 Old Salem Rd SE
- 1388 Fall River Dr
- 2730 Wellington Way SE Unit 2
- 2710 Wellington Way SE
- 0 Wellington Way SE Unit 8372518
- 0 Wellington Way SE Unit 8640274
- 0 Wellington Way SE Unit 8750575
- 0 Wellington Way SE Unit 8878957
- 0 Wellington Way SE Unit 3080270
- 0 Wellington Way SE Unit 3085675
- 0 Wellington Way SE Unit 3272742
- 0 Wellington Way SE Unit 7036683
- 0 Wellington Way SE Unit 7220881
- 0 Wellington Way SE Unit 7251086
- 0 Wellington Way SE Unit 7278193
- 0 Wellington Way SE Unit 8030261
- 0 Wellington Way SE
- 2700 Wellington Way SE
- 2740 Wellington Way SE
- 1800 Lancaster Dr SE Unit 2
- 1801 Lancaster Dr SE
- 2690 Wellington Way SE Unit 2