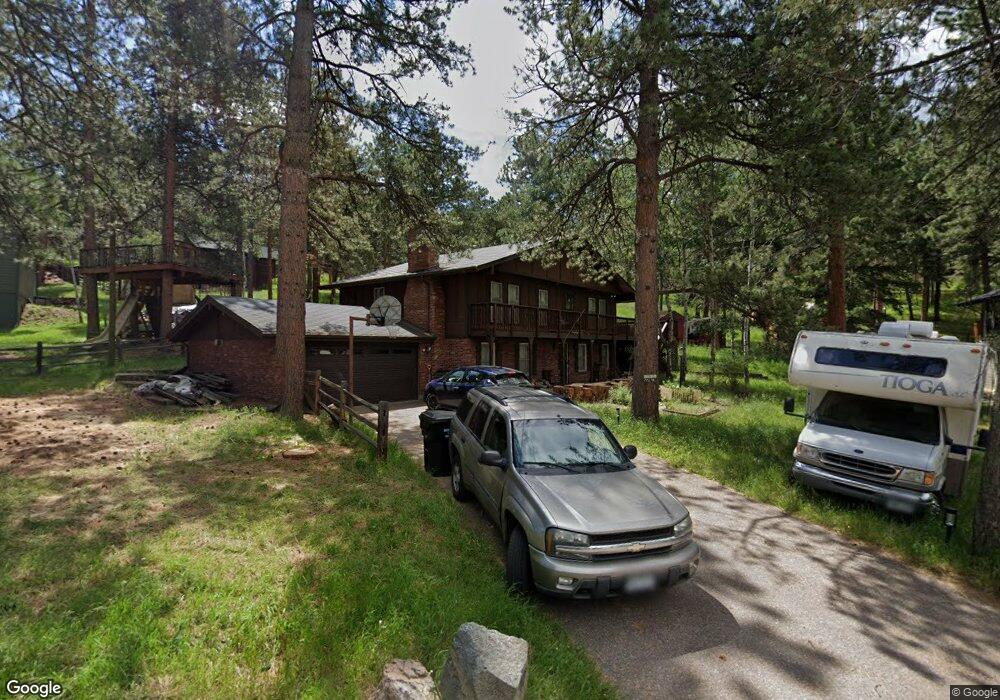
27206 Mountain Park Rd Evergreen, CO 80439
Estimated Value: $819,000 - $943,294
4
Beds
3
Baths
2,492
Sq Ft
$357/Sq Ft
Est. Value
About This Home
This home is located at 27206 Mountain Park Rd, Evergreen, CO 80439 and is currently estimated at $888,574, approximately $356 per square foot. 27206 Mountain Park Rd is a home located in Jefferson County with nearby schools including Wilmot Elementary School, Evergreen Middle School, and Evergreen High School.
Ownership History
Date
Name
Owned For
Owner Type
Purchase Details
Closed on
May 20, 2016
Sold by
Kibler Linda M and Kibler Richard A
Bought by
Chocol Todd C and Chocol Traci M
Current Estimated Value
Home Financials for this Owner
Home Financials are based on the most recent Mortgage that was taken out on this home.
Original Mortgage
$364,000
Outstanding Balance
$289,107
Interest Rate
3.59%
Mortgage Type
New Conventional
Estimated Equity
$599,467
Purchase Details
Closed on
Feb 24, 2003
Sold by
Kibler Linda M
Bought by
Kibler Linda M and Kibler Richard A
Purchase Details
Closed on
Dec 2, 2002
Sold by
Kibler Richard and Kibler Linda M
Bought by
Kibler Linda M
Home Financials for this Owner
Home Financials are based on the most recent Mortgage that was taken out on this home.
Original Mortgage
$222,000
Interest Rate
6.05%
Mortgage Type
Stand Alone First
Create a Home Valuation Report for This Property
The Home Valuation Report is an in-depth analysis detailing your home's value as well as a comparison with similar homes in the area
Home Values in the Area
Average Home Value in this Area
Purchase History
| Date | Buyer | Sale Price | Title Company |
|---|---|---|---|
| Chocol Todd C | $455,000 | Chicago Title | |
| Kibler Linda M | -- | -- | |
| Kibler Linda M | -- | -- |
Source: Public Records
Mortgage History
| Date | Status | Borrower | Loan Amount |
|---|---|---|---|
| Open | Chocol Todd C | $364,000 | |
| Previous Owner | Kibler Linda M | $222,000 |
Source: Public Records
Tax History Compared to Growth
Tax History
| Year | Tax Paid | Tax Assessment Tax Assessment Total Assessment is a certain percentage of the fair market value that is determined by local assessors to be the total taxable value of land and additions on the property. | Land | Improvement |
|---|---|---|---|---|
| 2024 | $4,517 | $49,258 | $15,270 | $33,988 |
| 2023 | $4,517 | $49,258 | $15,270 | $33,988 |
| 2022 | $3,570 | $37,792 | $9,834 | $27,958 |
| 2021 | $3,607 | $38,879 | $10,117 | $28,762 |
| 2020 | $3,312 | $35,423 | $8,834 | $26,589 |
| 2019 | $3,266 | $35,423 | $8,834 | $26,589 |
| 2018 | $3,123 | $32,760 | $7,543 | $25,217 |
| 2017 | $2,843 | $32,760 | $7,543 | $25,217 |
| 2016 | $2,070 | $22,287 | $6,980 | $15,307 |
| 2015 | $2,440 | $22,287 | $6,980 | $15,307 |
| 2014 | $2,440 | $25,491 | $5,989 | $19,502 |
Source: Public Records
Map
Nearby Homes
- 4924 S Indian Trail
- 0 Tbd Mountain Park Rd
- 27506 Mountain Park Rd
- 4786 Forest Hill Rd
- 5233 S Road A
- 26367 Bell Park Dr
- 5020 Liberty Dr
- 000 Forest Hill Rd
- 4978 Camel Heights Rd
- 4912 Silver Spruce Ln
- 4888 Silver Spruce Ln Unit 51
- 4642 Plettner Ln
- 4464 Forest Trail
- 4805 Blue Spruce Rd
- 27901 Pine Dr
- 0 Fern Gulch Unit REC6395499
- 27579 Fireweed Dr
- 28094 Harebell Ln
- 26978 Mesa Dr
- 28585 Evergreen Manor Dr
- 27226 Mountain Park Rd
- 4963 White House Trail
- 27166 Mountain Park Rd
- 4999 S Indian Trail
- 27205 Mountain Park Rd
- 5003 White House Trail
- 27296 Mountain Park Rd
- 4975 S Indian Trail
- 4990 White House Trail
- 5002 White House Trail
- 0 Whitehouse Trail Unit 855099
- 4972 White House Trail
- 4976 White House Trail
- 27207 Mountain Park Rd
- 27225 Mountain Park Rd
- 27135 Mountain Park Rd
- 4982 White House Trail
- 4998 White House Trail
- 27216 Mountain Park Rd
- 27235 Mountain Park Rd