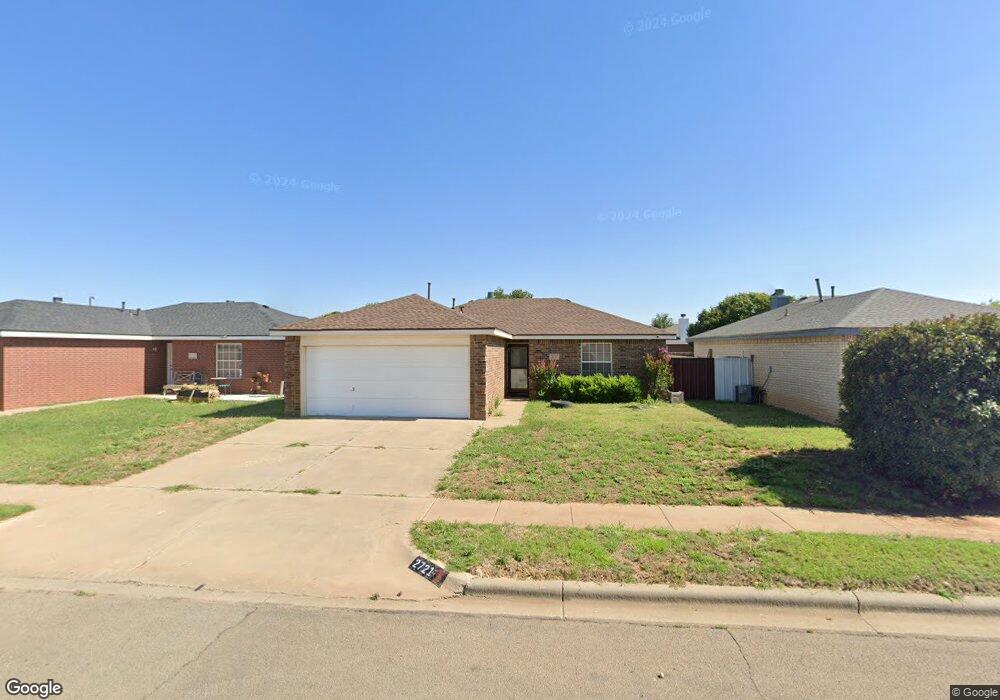
2721 108th St Lubbock, TX 79423
Estimated Value: $170,000 - $181,000
3
Beds
2
Baths
1,180
Sq Ft
$149/Sq Ft
Est. Value
About This Home
This home is located at 2721 108th St, Lubbock, TX 79423 and is currently estimated at $175,774, approximately $148 per square foot. 2721 108th St is a home located in Lubbock County with nearby schools including Lubbock-Cooper North Elementary School, Laura Bush Middle School, and Lubbock-Cooper Liberty High School.
Ownership History
Date
Name
Owned For
Owner Type
Purchase Details
Closed on
May 20, 2008
Sold by
Gilbert Lyndell V and Gilbert Stacy E
Bought by
Calicoat Michael L
Current Estimated Value
Home Financials for this Owner
Home Financials are based on the most recent Mortgage that was taken out on this home.
Original Mortgage
$89,294
Outstanding Balance
$56,490
Interest Rate
5.86%
Mortgage Type
Purchase Money Mortgage
Estimated Equity
$119,284
Purchase Details
Closed on
Jun 28, 2002
Sold by
Terrasue Inc Dba
Bought by
Calicoat Michael L
Create a Home Valuation Report for This Property
The Home Valuation Report is an in-depth analysis detailing your home's value as well as a comparison with similar homes in the area
Home Values in the Area
Average Home Value in this Area
Purchase History
| Date | Buyer | Sale Price | Title Company |
|---|---|---|---|
| Calicoat Michael L | -- | Stewart Title | |
| Calicoat Michael L | -- | -- |
Source: Public Records
Mortgage History
| Date | Status | Borrower | Loan Amount |
|---|---|---|---|
| Open | Calicoat Michael L | $89,294 |
Source: Public Records
Tax History Compared to Growth
Tax History
| Year | Tax Paid | Tax Assessment Tax Assessment Total Assessment is a certain percentage of the fair market value that is determined by local assessors to be the total taxable value of land and additions on the property. | Land | Improvement |
|---|---|---|---|---|
| 2025 | $2,183 | $164,064 | $14,674 | $149,390 |
| 2024 | $2,183 | $161,476 | $14,674 | $146,802 |
| 2023 | $3,250 | $154,469 | $14,674 | $139,795 |
| 2022 | $3,211 | $140,426 | $14,674 | $129,279 |
| 2021 | $3,068 | $127,660 | $14,674 | $112,986 |
| 2020 | $2,914 | $117,518 | $14,674 | $102,844 |
| 2019 | $2,922 | $114,594 | $14,674 | $99,920 |
| 2018 | $2,784 | $109,043 | $14,674 | $94,369 |
| 2017 | $2,815 | $110,153 | $14,674 | $95,479 |
| 2016 | $2,667 | $104,365 | $14,674 | $89,691 |
| 2015 | $2,045 | $96,107 | $11,638 | $84,469 |
| 2014 | $2,045 | $90,006 | $11,638 | $78,368 |
Source: Public Records
Map
Nearby Homes