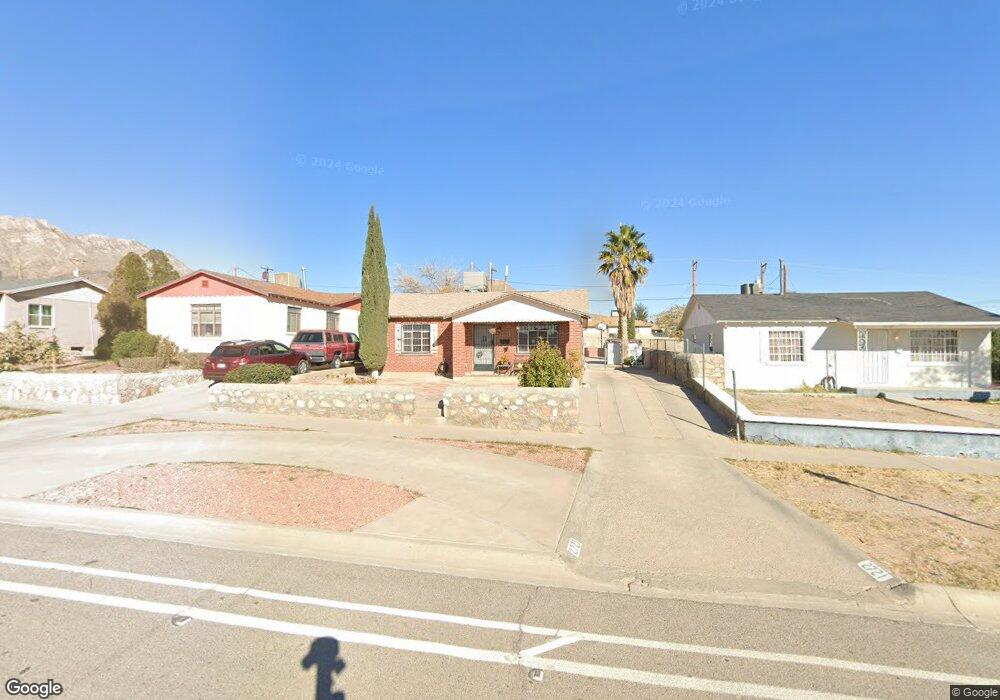
2721 Fort Blvd El Paso, TX 79930
Central NeighborhoodEstimated Value: $140,000 - $182,000
--
Bed
1
Bath
915
Sq Ft
$169/Sq Ft
Est. Value
About This Home
This home is located at 2721 Fort Blvd, El Paso, TX 79930 and is currently estimated at $154,810, approximately $169 per square foot. 2721 Fort Blvd is a home located in El Paso County with nearby schools including Clendenin Elementary School, Middle School-5 NW Middle, and Austin High School.
Ownership History
Date
Name
Owned For
Owner Type
Purchase Details
Closed on
May 6, 2021
Sold by
Zubia Cruz
Bought by
Zubia Gabriela Alejandra
Current Estimated Value
Home Financials for this Owner
Home Financials are based on the most recent Mortgage that was taken out on this home.
Original Mortgage
$115,665
Outstanding Balance
$87,404
Interest Rate
3%
Mortgage Type
New Conventional
Estimated Equity
$67,406
Purchase Details
Closed on
May 12, 1995
Sold by
Navarro Olga
Bought by
Zubia Cruz
Home Financials for this Owner
Home Financials are based on the most recent Mortgage that was taken out on this home.
Original Mortgage
$31,500
Interest Rate
8.35%
Purchase Details
Closed on
Jul 23, 1992
Sold by
Cueto Mario A and Cueto Sylvia Navarro
Bought by
Navarro Olga
Home Financials for this Owner
Home Financials are based on the most recent Mortgage that was taken out on this home.
Original Mortgage
$20,500
Interest Rate
8.48%
Create a Home Valuation Report for This Property
The Home Valuation Report is an in-depth analysis detailing your home's value as well as a comparison with similar homes in the area
Home Values in the Area
Average Home Value in this Area
Purchase History
| Date | Buyer | Sale Price | Title Company |
|---|---|---|---|
| Zubia Gabriela Alejandra | -- | None Available | |
| Zubia Cruz | -- | -- | |
| Navarro Olga | -- | -- |
Source: Public Records
Mortgage History
| Date | Status | Borrower | Loan Amount |
|---|---|---|---|
| Open | Zubia Gabriela Alejandra | $115,665 | |
| Previous Owner | Zubia Cruz | $31,500 | |
| Previous Owner | Navarro Olga | $20,500 | |
| Closed | Zubia Cruz | $13,450 |
Source: Public Records
Tax History Compared to Growth
Tax History
| Year | Tax Paid | Tax Assessment Tax Assessment Total Assessment is a certain percentage of the fair market value that is determined by local assessors to be the total taxable value of land and additions on the property. | Land | Improvement |
|---|---|---|---|---|
| 2025 | $559 | $75,373 | -- | -- |
| 2024 | $559 | $68,521 | -- | -- |
| 2023 | $559 | $62,292 | $0 | $0 |
| 2022 | $1,676 | $56,629 | $0 | $0 |
| 2021 | $1,607 | $69,777 | $15,579 | $54,198 |
| 2020 | $1,438 | $46,801 | $15,579 | $31,222 |
| 2018 | $1,354 | $45,753 | $15,579 | $30,174 |
| 2017 | $1,389 | $49,307 | $15,579 | $33,728 |
| 2016 | $1,583 | $56,215 | $15,579 | $40,636 |
| 2015 | $622 | $56,215 | $15,579 | $40,636 |
| 2014 | $622 | $56,454 | $15,579 | $40,875 |
Source: Public Records
Map
Nearby Homes
- 3027 Morehead Ave
- 3031 Fort Blvd
- 2816 N Piedras St
- PN-391630 Alabama St
- 2917 Mobile Ave
- PN-258825 Tbd
- 3018 Sacramento Ave
- 3904 N Piedras St Unit A-B
- 3125 Hamilton Ave
- 3021 Monroe Ave
- 3215 Mobile Ave
- 2610 Frankfort Ave
- 3104 Van Buren Ave
- 2903 Savannah Ave
- 3009 Savannah Ave
- 3204 Memphis Ave
- 3327 Mobile Ave
- 2801 Polk Ave
- 3427 Hamilton Ave
- 3510 Porter Ave
- 2725 Fort Blvd
- 2719 Fort Blvd
- 2729 Fort Blvd
- 2715 Fort Blvd
- 2720 Morehead Ave
- 2732 Morehead Ave
- 2716 Morehead Ave
- 2734 Morehead Ave
- 2705 Fort Blvd
- 2708 Morehead Ave
- 2726 Fort Blvd
- 2801 Fort Blvd
- 2720 Fort Blvd
- 2724 Fort Blvd
- 2724 Fort Blvd
- 2704 Morehead Ave
- 2716 Fort Blvd
- 2701 Fort Blvd
- 2703 Fort Blvd
- 2712 Fort Blvd