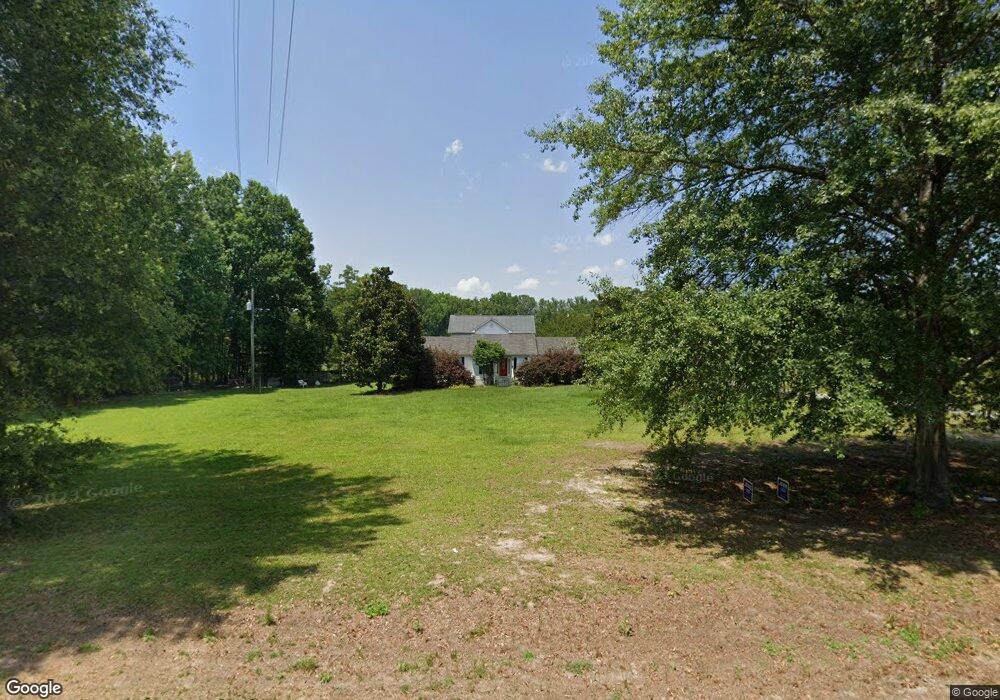
2721 White Oak Rd Thomson, GA 30824
Estimated Value: $279,000 - $405,536
3
Beds
2
Baths
1,516
Sq Ft
$226/Sq Ft
Est. Value
About This Home
This home is located at 2721 White Oak Rd, Thomson, GA 30824 and is currently estimated at $342,634, approximately $226 per square foot. 2721 White Oak Rd is a home located in McDuffie County with nearby schools including Thomson High School.
Ownership History
Date
Name
Owned For
Owner Type
Purchase Details
Closed on
Nov 22, 2017
Sold by
Boone Lashawn K
Bought by
Boone Cary R
Current Estimated Value
Home Financials for this Owner
Home Financials are based on the most recent Mortgage that was taken out on this home.
Original Mortgage
$151,500
Outstanding Balance
$83,503
Interest Rate
3.94%
Mortgage Type
New Conventional
Estimated Equity
$259,131
Purchase Details
Closed on
Oct 26, 2012
Sold by
Boone Cary R
Bought by
Boone Lashawn K
Home Financials for this Owner
Home Financials are based on the most recent Mortgage that was taken out on this home.
Original Mortgage
$176,000
Interest Rate
3.42%
Mortgage Type
New Conventional
Purchase Details
Closed on
Apr 26, 2010
Sold by
Mertins Tammy H
Bought by
Boone Cary R
Home Financials for this Owner
Home Financials are based on the most recent Mortgage that was taken out on this home.
Original Mortgage
$123,500
Interest Rate
4.99%
Mortgage Type
New Conventional
Purchase Details
Closed on
Sep 12, 2000
Sold by
Coleman Ronald L
Bought by
Hobbs Tammy C
Create a Home Valuation Report for This Property
The Home Valuation Report is an in-depth analysis detailing your home's value as well as a comparison with similar homes in the area
Home Values in the Area
Average Home Value in this Area
Purchase History
| Date | Buyer | Sale Price | Title Company |
|---|---|---|---|
| Boone Cary R | -- | -- | |
| Boone Lashawn K | -- | -- | |
| Boone Cary R | $130,000 | -- | |
| Hobbs Tammy C | -- | -- |
Source: Public Records
Mortgage History
| Date | Status | Borrower | Loan Amount |
|---|---|---|---|
| Open | Boone Cary R | $151,500 | |
| Previous Owner | Boone Lashawn K | $176,000 | |
| Previous Owner | Boone Cary R | $123,500 |
Source: Public Records
Tax History Compared to Growth
Tax History
| Year | Tax Paid | Tax Assessment Tax Assessment Total Assessment is a certain percentage of the fair market value that is determined by local assessors to be the total taxable value of land and additions on the property. | Land | Improvement |
|---|---|---|---|---|
| 2024 | $3,247 | $136,951 | $5,535 | $131,416 |
| 2023 | $3,247 | $131,528 | $5,535 | $125,993 |
| 2022 | $3,274 | $126,391 | $5,535 | $120,856 |
| 2021 | $2,648 | $100,461 | $5,374 | $95,087 |
| 2020 | $2,207 | $82,274 | $5,398 | $76,876 |
| 2019 | $2,230 | $82,274 | $5,398 | $76,876 |
| 2018 | $2,230 | $82,274 | $5,398 | $76,876 |
| 2017 | $2,152 | $82,274 | $5,398 | $76,876 |
| 2016 | $2,152 | $82,274 | $5,398 | $76,876 |
| 2015 | $2,002 | $83,940 | $5,433 | $78,508 |
| 2014 | $2,006 | $83,941 | $5,434 | $78,508 |
| 2013 | -- | $83,941 | $5,433 | $78,507 |
Source: Public Records
Map
Nearby Homes
- 2592 White Oak Rd
- 421 Liberty St
- 0 Liberty St
- 139 Margarets Rd
- 651 Moose Club Rd
- 705 Marshall Church Rd
- 1086 Boneville Rd
- 219 Devonshire Dr
- 563 Lakewood Dr
- 1302 Elias Station
- 1290 Elias Station
- 1379 Elias Station
- 1283 Elias Station
- 1282 Elias Station
- 146 Willow Oak Cir
- 122 Willow Oak Cir
- 137 Willow Oak Cir
- 123 Willow Oak Cir
- 125 Willow Oak Cir
- 7409 Fullbright Rd
- 2741 White Oak Rd
- 2706 White Oak Rd
- 2688 White Oak Rd
- 2670 White Oak Rd
- 2654 White Oak Rd
- 149 Moose Club Rd
- 2629 White Oak Rd
- 2636 White Oak Rd
- 2789 White Oak Rd
- 2622 White Oak Rd
- 181 Moose Club Rd
- 2606 White Oak Rd
- 2593 White Oak Rd
- 213 Moose Club Rd
- 134 Mynatt Rd
- 202 Mynatt Rd
- 2568 White Oak Rd
- 227 Moose Club Rd
- 220 Moose Club Rd
- 224 Mynatt Rd