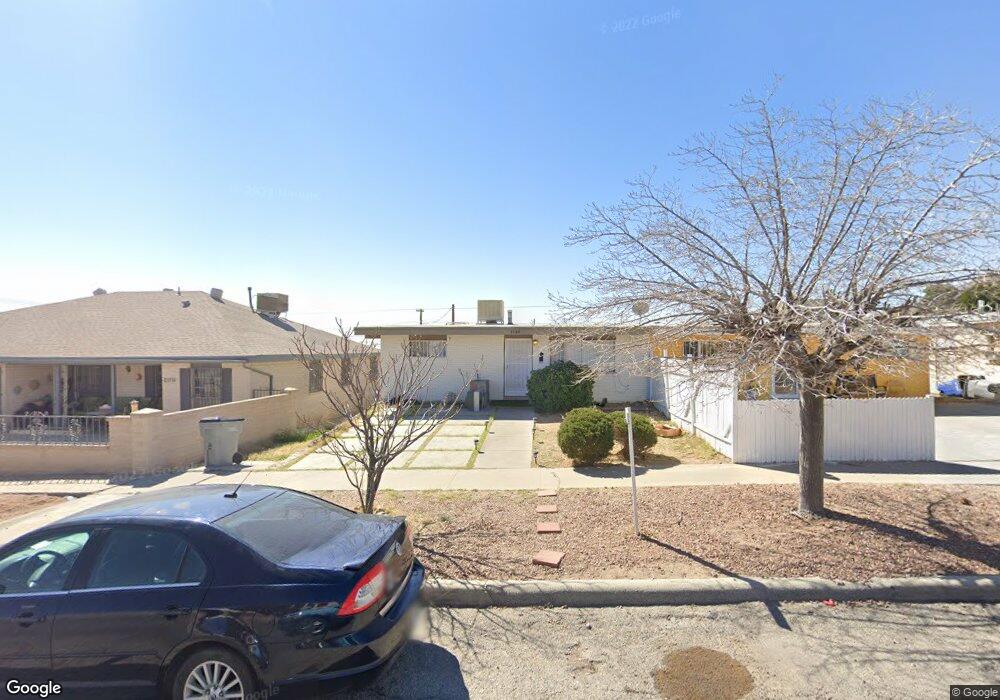
2722 Mckinley Ave Unit 1 El Paso, TX 79930
Central NeighborhoodEstimated Value: $126,334 - $258,000
2
Beds
1
Bath
744
Sq Ft
$245/Sq Ft
Est. Value
About This Home
This home is located at 2722 Mckinley Ave Unit 1, El Paso, TX 79930 and is currently estimated at $182,334, approximately $245 per square foot. 2722 Mckinley Ave Unit 1 is a home located in El Paso County with nearby schools including Clendenin Elementary School, Middle School-5 NW Middle, and Austin High School.
Ownership History
Date
Name
Owned For
Owner Type
Purchase Details
Closed on
Feb 16, 2023
Sold by
Vazquez Juventino
Bought by
Garcia Ana M Castro
Current Estimated Value
Purchase Details
Closed on
Aug 31, 2017
Sold by
Carrasco Antonia
Bought by
Vazquez Juventino and Garcia Ana Margarita Castro
Purchase Details
Closed on
Apr 9, 2013
Sold by
Escobedo Enrique and Escobedo Juana E
Bought by
Carrasco Antonia
Home Financials for this Owner
Home Financials are based on the most recent Mortgage that was taken out on this home.
Original Mortgage
$32,000
Interest Rate
3.56%
Mortgage Type
New Conventional
Purchase Details
Closed on
Oct 12, 1998
Sold by
Romero Richard Michael and Romero Grace Lynn
Bought by
Escobedo Enrique and Escobedo Juana E
Home Financials for this Owner
Home Financials are based on the most recent Mortgage that was taken out on this home.
Original Mortgage
$24,000
Interest Rate
6.73%
Create a Home Valuation Report for This Property
The Home Valuation Report is an in-depth analysis detailing your home's value as well as a comparison with similar homes in the area
Home Values in the Area
Average Home Value in this Area
Purchase History
| Date | Buyer | Sale Price | Title Company |
|---|---|---|---|
| Garcia Ana M Castro | -- | -- | |
| Vazquez Juventino | -- | None Available | |
| Carrasco Antonia | -- | None Available | |
| Escobedo Enrique | -- | -- |
Source: Public Records
Mortgage History
| Date | Status | Borrower | Loan Amount |
|---|---|---|---|
| Previous Owner | Carrasco Antonia | $32,000 | |
| Previous Owner | Escobedo Enrique | $24,000 |
Source: Public Records
Tax History Compared to Growth
Tax History
| Year | Tax Paid | Tax Assessment Tax Assessment Total Assessment is a certain percentage of the fair market value that is determined by local assessors to be the total taxable value of land and additions on the property. | Land | Improvement |
|---|---|---|---|---|
| 2025 | $2,388 | $99,088 | $20,940 | $78,148 |
| 2024 | $2,388 | $91,984 | $20,940 | $71,044 |
| 2023 | $2,087 | $75,451 | $12,464 | $62,987 |
| 2022 | $1,905 | $64,362 | $12,464 | $51,898 |
| 2021 | $1,733 | $55,513 | $12,464 | $43,049 |
| 2020 | $1,148 | $37,348 | $12,464 | $24,884 |
| 2018 | $1,105 | $37,348 | $12,464 | $24,884 |
| 2017 | $1,038 | $36,861 | $12,464 | $24,397 |
| 2016 | $1,179 | $41,858 | $12,464 | $29,394 |
| 2015 | $1,145 | $41,858 | $12,464 | $29,394 |
| 2014 | $1,145 | $41,858 | $12,464 | $29,394 |
Source: Public Records
Map
Nearby Homes
- 3904 N Piedras St Unit A-B
- 3027 Morehead Ave
- 3021 Monroe Ave
- 3031 Fort Blvd
- 3104 Van Buren Ave
- 2801 Polk Ave
- PN-258825 Tbd
- 2704 Taylor Ave
- 2816 N Piedras St
- 3125 Hamilton Ave
- PN-391630 Alabama St
- 2917 Mobile Ave
- 3018 Sacramento Ave
- 3413 Monroe Ave
- 3312 Polk Ave
- 3010 Pierce Ave
- 3215 Mobile Ave
- 3510 Porter Ave
- 3427 Hamilton Ave
- 3327 Mobile Ave
- 2722 Mckinley Ave
- 2722 Mckinley Ave Unit 2722
- 2724 Mckinley Ave
- 3605 Elm St
- 2716 Mckinley Ave Unit 2722
- 2712 Mckinley Ave
- 2727 Mountain Ave
- 2723 Mountain Ave
- 2731 Mountain Ave
- 2705 Mckinley Ave
- 2708 Mckinley Ave
- 2715 Mountain Ave Unit 2715 1/2
- 2725 Mckinley Ave
- 2729 Mckinley Ave
- 2719 Mckinley Ave
- 2802 Mckinley Ave Unit 2804
- 2715 Mckinley Ave
- 2705 Mountain Ave
- 2801 Mountain Ave
- 2711 Mckinley Ave