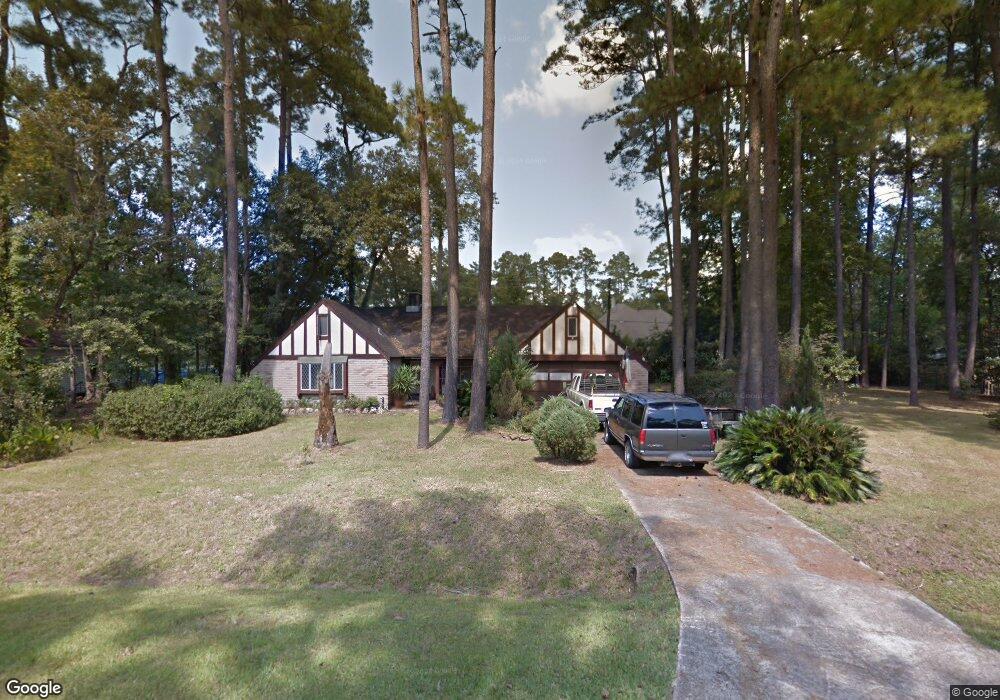
2722 Rapho St Crosby, TX 77532
Estimated Value: $274,000 - $331,000
3
Beds
3
Baths
1,759
Sq Ft
$170/Sq Ft
Est. Value
About This Home
This home is located at 2722 Rapho St, Crosby, TX 77532 and is currently estimated at $298,813, approximately $169 per square foot. 2722 Rapho St is a home located in Harris County with nearby schools including Newport Elementary School, Crosby Middle School, and Crosby High School.
Ownership History
Date
Name
Owned For
Owner Type
Purchase Details
Closed on
May 1, 2009
Sold by
Bissonnet Pete and Bissonnet Alba Rocio
Bought by
Schmidt Walter E and Schmidt Marie Q
Current Estimated Value
Home Financials for this Owner
Home Financials are based on the most recent Mortgage that was taken out on this home.
Original Mortgage
$93,884
Outstanding Balance
$59,286
Interest Rate
4.84%
Mortgage Type
FHA
Estimated Equity
$239,527
Purchase Details
Closed on
Apr 22, 2009
Sold by
Bissonnet Pete and Bissonnet Alba Rocio
Bought by
Bissonnet Pete and Bissonnet Alba Rocio
Home Financials for this Owner
Home Financials are based on the most recent Mortgage that was taken out on this home.
Original Mortgage
$93,884
Outstanding Balance
$59,286
Interest Rate
4.84%
Mortgage Type
FHA
Estimated Equity
$239,527
Create a Home Valuation Report for This Property
The Home Valuation Report is an in-depth analysis detailing your home's value as well as a comparison with similar homes in the area
Home Values in the Area
Average Home Value in this Area
Purchase History
| Date | Buyer | Sale Price | Title Company |
|---|---|---|---|
| Schmidt Walter E | -- | Texas American Title Company | |
| Bissonnet Pete | -- | Texas American Title Company |
Source: Public Records
Mortgage History
| Date | Status | Borrower | Loan Amount |
|---|---|---|---|
| Open | Schmidt Walter E | $93,884 |
Source: Public Records
Tax History Compared to Growth
Tax History
| Year | Tax Paid | Tax Assessment Tax Assessment Total Assessment is a certain percentage of the fair market value that is determined by local assessors to be the total taxable value of land and additions on the property. | Land | Improvement |
|---|---|---|---|---|
| 2025 | $1,144 | $259,268 | $122,496 | $136,772 |
| 2024 | $1,144 | $255,171 | $105,600 | $149,571 |
| 2023 | $1,144 | $275,817 | $102,120 | $173,697 |
| 2022 | $5,561 | $237,430 | $75,480 | $161,950 |
| 2021 | $5,212 | $194,153 | $53,280 | $140,873 |
| 2020 | $5,460 | $192,303 | $53,280 | $139,023 |
| 2019 | $5,285 | $178,627 | $53,280 | $125,347 |
| 2018 | $1,284 | $163,014 | $40,848 | $122,166 |
| 2017 | $4,525 | $151,830 | $31,968 | $119,862 |
| 2016 | $4,525 | $151,830 | $31,968 | $119,862 |
| 2015 | $2,112 | $151,830 | $31,968 | $119,862 |
| 2014 | $2,112 | $131,452 | $31,968 | $99,484 |
Source: Public Records
Map
Nearby Homes
- 2731 Rapho St
- 2655 Homestead Ranch Ln
- 2651 Homestead Ranch Ln
- 2623 Colorado Creek Dr
- 18735 Etta Pines Cir
- 18602 Redford Springs Ct
- 18802 Spokane Falls Trail
- 18934 Spokane Falls Trail
- 2415 Serrano Plains Trail
- 2922 Indian Mound Trail
- 2419 Elliot Canyon Ln
- The Pioneer (L470) Plan at Sundance Cove - Classic Series
- The Ian (L465) Plan at Sundance Cove - Classic Series
- The Pearl (L452) Plan at Sundance Cove - Classic Series
- The Royal (L481) Plan at Sundance Cove - Classic Series
- The Kendall (L485) Plan at Sundance Cove - Classic Series
- The Kessler (L454) Plan at Sundance Cove - Classic Series
- The Oleander (L401) Plan at Sundance Cove - Classic Series
- The Preston (L403) Plan at Sundance Cove - Classic Series
- The Henderson (L404) Plan at Sundance Cove - Classic Series
- 2715 Foley Rd
- 2730 Rapho St
- 2727 Foley Rd
- 2723 Rapho St
- 2727 Rapho St
- 2731 Foley Rd
- 2711 Foley Rd
- 2719 Rapho St
- 0 Rapho Dr
- 2702 Rapho St
- 2707 Foley Rd
- 2707 Rapho St
- 2730 Deep Anchor Way
- 2703 Foley Rd
- 2803 Foley Rd
- 2803 Rapho St
- 2706 Deep Anchor Way
- 2727 Homestead Ranch Ln
- 2703 Homestead Ranch Ln
- 2635 Foley Rd