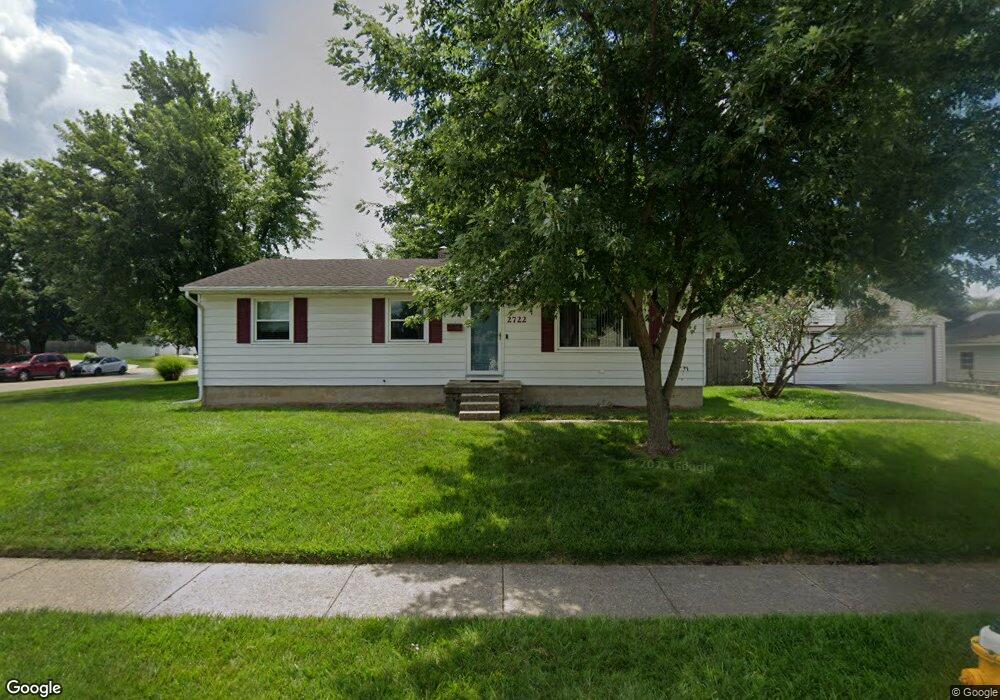
2722 Vale Dr Dayton, OH 45420
Estimated Value: $187,000 - $196,000
3
Beds
2
Baths
1,008
Sq Ft
$190/Sq Ft
Est. Value
About This Home
This home is located at 2722 Vale Dr, Dayton, OH 45420 and is currently estimated at $191,177, approximately $189 per square foot. 2722 Vale Dr is a home located in Montgomery County with nearby schools including Indian Riffle Elementary School, Kettering Middle School, and Kettering Fairmont High School.
Ownership History
Date
Name
Owned For
Owner Type
Purchase Details
Closed on
May 24, 2010
Sold by
Koverman Suzanne M
Bought by
Koverman Douglas E
Current Estimated Value
Home Financials for this Owner
Home Financials are based on the most recent Mortgage that was taken out on this home.
Original Mortgage
$77,500
Outstanding Balance
$52,174
Interest Rate
5.14%
Mortgage Type
New Conventional
Estimated Equity
$139,003
Purchase Details
Closed on
Aug 2, 2000
Sold by
Pennucci Michael P S and Pennucci S Linda
Bought by
Koverman Douglas E and Koverman Suzanne M
Home Financials for this Owner
Home Financials are based on the most recent Mortgage that was taken out on this home.
Original Mortgage
$82,900
Interest Rate
7.99%
Purchase Details
Closed on
Jun 10, 1997
Sold by
Hiller Darby L
Bought by
Pennucci Michael Paul and Pennucci Linda Sue
Create a Home Valuation Report for This Property
The Home Valuation Report is an in-depth analysis detailing your home's value as well as a comparison with similar homes in the area
Home Values in the Area
Average Home Value in this Area
Purchase History
| Date | Buyer | Sale Price | Title Company |
|---|---|---|---|
| Koverman Douglas E | -- | Attorney | |
| Koverman Douglas E | $89,900 | -- | |
| Pennucci Michael Paul | $90,000 | -- |
Source: Public Records
Mortgage History
| Date | Status | Borrower | Loan Amount |
|---|---|---|---|
| Open | Koverman Douglas E | $77,500 | |
| Previous Owner | Koverman Douglas E | $82,900 |
Source: Public Records
Tax History Compared to Growth
Tax History
| Year | Tax Paid | Tax Assessment Tax Assessment Total Assessment is a certain percentage of the fair market value that is determined by local assessors to be the total taxable value of land and additions on the property. | Land | Improvement |
|---|---|---|---|---|
| 2024 | $3,272 | $46,950 | $11,570 | $35,380 |
| 2023 | $3,272 | $46,950 | $11,570 | $35,380 |
| 2022 | $3,232 | $36,420 | $8,970 | $27,450 |
| 2021 | $3,017 | $36,420 | $8,970 | $27,450 |
| 2020 | $3,025 | $36,420 | $8,970 | $27,450 |
| 2019 | $3,053 | $32,540 | $8,970 | $23,570 |
| 2018 | $3,067 | $32,540 | $8,970 | $23,570 |
| 2017 | $2,854 | $32,540 | $8,970 | $23,570 |
| 2016 | $2,673 | $28,330 | $8,970 | $19,360 |
| 2015 | $2,571 | $28,330 | $8,970 | $19,360 |
| 2014 | $2,571 | $28,330 | $8,970 | $19,360 |
| 2012 | -- | $31,350 | $9,020 | $22,330 |
Source: Public Records
Map
Nearby Homes
- 2808 Whitehorse Ave
- 2843 Purdue Dr
- 2928 Prentice Dr
- 2925 Cunnington Ln
- 2631 Camino Place E
- 2845 Nacoma Place
- 2841 Chinook Ln
- 2530 Barryknoll St
- 2448 Bingham Ave
- 2853 Comanche Dr
- 4485 Longmeadow Ln
- 2420 Woodman Dr
- 520 Vineland Trail
- 3116 Powhattan Place
- 2200 County Line Rd
- 641 Angler Ct
- 2139 E Bataan Dr
- 2301 Danube Ct
- 4324 Straight Arrow Rd Unit 4324
- 2512 Olson Dr
- 2603 Blackhawk Rd
- 2712 Vale Dr
- 2607 Blackhawk Rd
- 2721 Vale Dr
- 2600 Blackhawk Rd
- 2798 Prentice Dr
- 2717 Vale Dr
- 2520 Blackhawk Rd
- 2701 Vale Dr
- 2611 Blackhawk Rd
- 2800 Prentice Dr
- 2804 Vale Dr
- 2612 Blackhawk Rd
- 2681 Vale Dr
- 2805 Vale Dr
- 2810 Prentice Dr
- 2648 Vale Dr
- 2615 Blackhawk Rd
- 2808 Vale Dr
- 2805 Whitehorse Ave