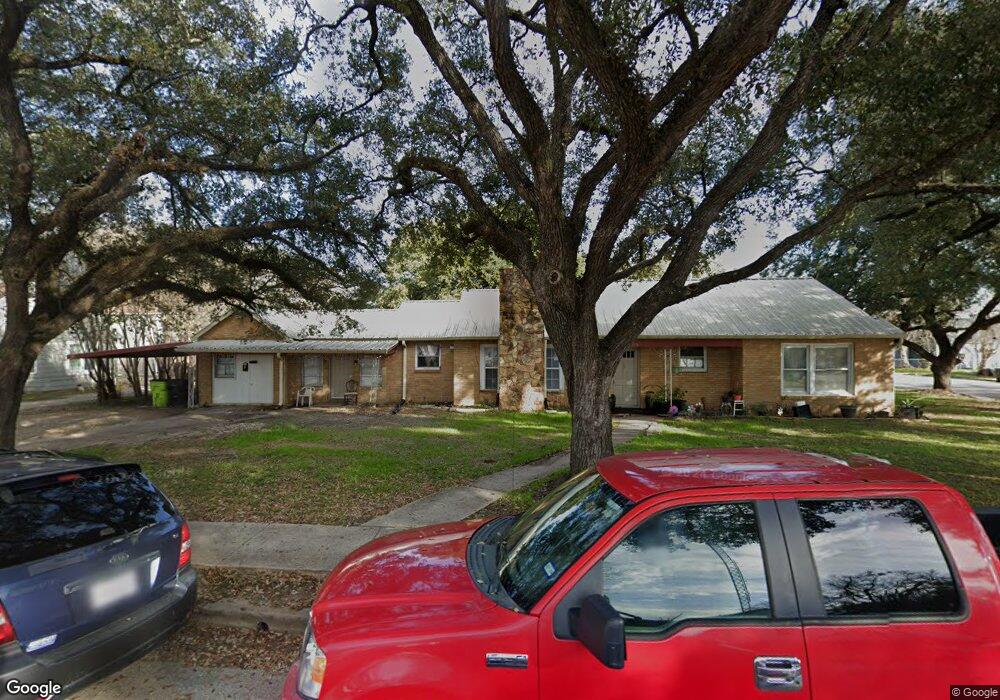
2723 Avenue G Rosenberg, TX 77471
Estimated Value: $274,525 - $322,000
3
Beds
2
Baths
2,239
Sq Ft
$133/Sq Ft
Est. Value
About This Home
This home is located at 2723 Avenue G, Rosenberg, TX 77471 and is currently estimated at $297,175, approximately $132 per square foot. 2723 Avenue G is a home located in Fort Bend County with nearby schools including Travis Elementary School, Navarro Middle School, and George Junior High School.
Ownership History
Date
Name
Owned For
Owner Type
Purchase Details
Closed on
Nov 30, 2015
Sold by
Sunsara Rahil R
Bought by
Argueta Rosibel Dela Paz and Guevara Rosa M
Current Estimated Value
Purchase Details
Closed on
Apr 2, 2013
Sold by
Danielson Ernest L
Bought by
Sunsara Rahil R
Purchase Details
Closed on
May 30, 1997
Sold by
Snow Nancy J Garmany
Bought by
Danielson Earnest and Alanis Jose Luis
Create a Home Valuation Report for This Property
The Home Valuation Report is an in-depth analysis detailing your home's value as well as a comparison with similar homes in the area
Home Values in the Area
Average Home Value in this Area
Purchase History
| Date | Buyer | Sale Price | Title Company |
|---|---|---|---|
| Argueta Rosibel Dela Paz | -- | Metropolitian Escrow & Title | |
| Guevara Rosa M | -- | -- | |
| Sunsara Rahil R | $49,000 | None Available | |
| Guevara Rosa M | -- | -- | |
| Danielson Earnest | -- | Rosenberg Title Co |
Source: Public Records
Tax History Compared to Growth
Tax History
| Year | Tax Paid | Tax Assessment Tax Assessment Total Assessment is a certain percentage of the fair market value that is determined by local assessors to be the total taxable value of land and additions on the property. | Land | Improvement |
|---|---|---|---|---|
| 2025 | $4,536 | $287,853 | $61,466 | $226,387 |
| 2024 | $4,536 | $240,150 | $61,466 | $178,684 |
| 2023 | $7,319 | $379,146 | $61,466 | $317,680 |
| 2022 | $4,646 | $226,850 | $61,470 | $165,380 |
| 2021 | $2,840 | $136,890 | $36,880 | $100,010 |
| 2020 | $2,898 | $136,550 | $36,880 | $99,670 |
| 2019 | $3,119 | $136,550 | $36,880 | $99,670 |
| 2018 | $3,043 | $131,120 | $36,880 | $94,240 |
| 2017 | $2,986 | $127,930 | $36,880 | $91,050 |
| 2016 | $2,988 | $128,030 | $36,880 | $91,150 |
| 2015 | $3,002 | $127,960 | $36,880 | $91,080 |
| 2014 | $2,998 | $126,230 | $36,880 | $89,350 |
Source: Public Records
Map
Nearby Homes