Estimated Value: $166,129 - $202,000
2
Beds
2
Baths
1,071
Sq Ft
$177/Sq Ft
Est. Value
About This Home
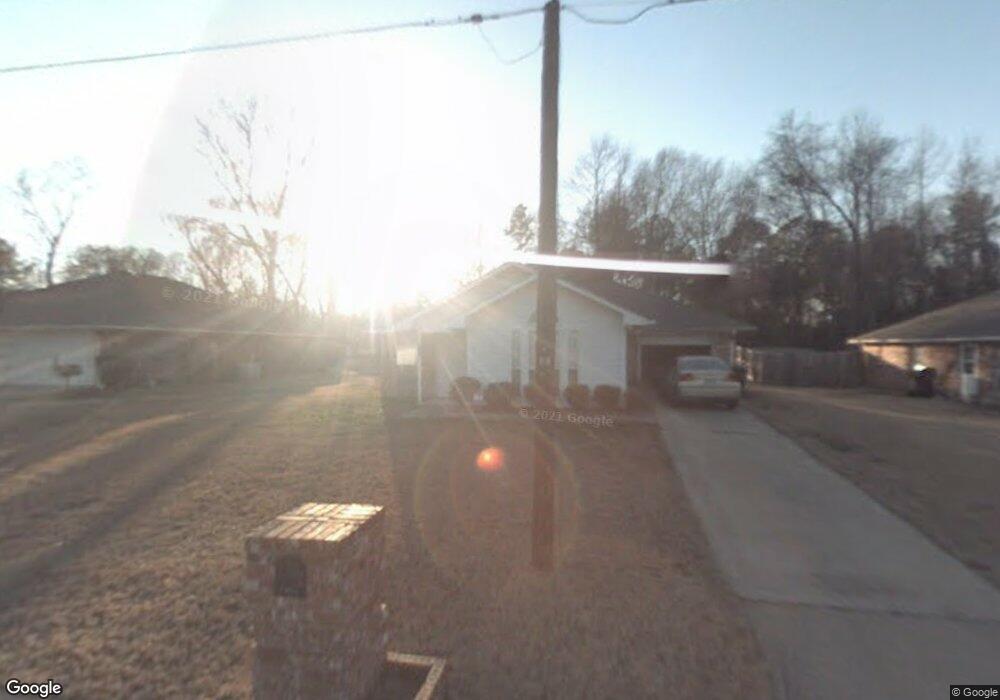
This home is located at 2723 Depriest Ave, Tyler, TX 75701 and is currently estimated at $189,532, approximately $176 per square foot. 2723 Depriest Ave is a home located in Smith County with nearby schools including Jones Elementary School, Three Lakes Middle School, and Tyler Legacy High School.
Ownership History
Date
Name
Owned For
Owner Type
Purchase Details
Closed on
Jul 7, 2022
Sold by
Martin Panda L
Bought by
Martinez Erik Emanuel and Sanchez Jennifer
Current Estimated Value
Home Financials for this Owner
Home Financials are based on the most recent Mortgage that was taken out on this home.
Original Mortgage
$176,739
Outstanding Balance
$167,671
Interest Rate
5.1%
Mortgage Type
FHA
Estimated Equity
$21,861
Purchase Details
Closed on
Sep 9, 2011
Sold by
Citizens 1St Bank Tyler Texas
Bought by
Martin Panda L
Home Financials for this Owner
Home Financials are based on the most recent Mortgage that was taken out on this home.
Original Mortgage
$66,276
Interest Rate
4.4%
Mortgage Type
FHA
Purchase Details
Closed on
Feb 1, 2011
Sold by
Freeman Pamela K and Freeman Kenneth D
Bought by
Citizens 1St Bank Tyler Texas
Create a Home Valuation Report for This Property
The Home Valuation Report is an in-depth analysis detailing your home's value as well as a comparison with similar homes in the area
Home Values in the Area
Average Home Value in this Area
Purchase History
| Date | Buyer | Sale Price | Title Company |
|---|---|---|---|
| Martinez Erik Emanuel | -- | New Title Company Name | |
| Martin Panda L | -- | None Available | |
| Citizens 1St Bank Tyler Texas | $49,212 | None Available |
Source: Public Records
Mortgage History
| Date | Status | Borrower | Loan Amount |
|---|---|---|---|
| Open | Martinez Erik Emanuel | $176,739 | |
| Previous Owner | Martin Panda L | $66,276 | |
| Closed | Martinez Erik Emanuel | $7,070 |
Source: Public Records
Tax History Compared to Growth
Tax History
| Year | Tax Paid | Tax Assessment Tax Assessment Total Assessment is a certain percentage of the fair market value that is determined by local assessors to be the total taxable value of land and additions on the property. | Land | Improvement |
|---|---|---|---|---|
| 2025 | $2,636 | $180,208 | $35,627 | $144,581 |
| 2024 | $2,636 | $154,936 | $8,400 | $146,536 |
| 2023 | $2,618 | $150,166 | $8,400 | $141,766 |
| 2022 | $2,321 | $133,848 | $8,400 | $125,448 |
| 2021 | $2,259 | $107,686 | $8,400 | $99,286 |
| 2020 | $2,124 | $102,638 | $8,400 | $94,238 |
| 2019 | $1,973 | $90,220 | $8,400 | $81,820 |
| 2018 | $1,863 | $85,662 | $8,400 | $77,262 |
| 2017 | $1,829 | $85,662 | $8,400 | $77,262 |
| 2016 | $1,725 | $80,782 | $8,400 | $72,382 |
| 2015 | $1,407 | $79,148 | $8,400 | $70,748 |
| 2014 | $1,407 | $76,696 | $8,400 | $68,296 |
Source: Public Records
Map
Nearby Homes
- 2711 Tol Ave
- 3018 Walton Rd
- 2712 Flint St
- 3010 Moorehead St
- 2322 Walton Rd
- 3209 Walton Rd
- 3012 Frankston Hwy
- 3016 Frankston Hwy
- 2940 Frankston Hwy
- 2986 Frankston Hwy
- 3004 Frankston Hwy
- 2950 Frankston Hwy
- 3008 Frankston Hwy
- 2954 Frankston Hwy
- 2928 Frankston Hwy
- 2934 Frankston Hwy
- 2922 Frankston Hwy
- 1408 Old Noonday Rd
- 2319 Luther St
- 1672 Alamo Crossing
- 2729 Depriest Ave
- 2719 Depriest Ave
- 2735 Depriest Ave
- 2711 Depriest Ave
- 2739 Depriest Ave
- 2709 Depriest Ave
- 2724 Depriest Ave
- 2728 Depriest Ave
- 2716 2716 Depriest Ave
- 2720 Depriest Ave
- 2732 Depriest Ave
- 2716 Depriest Ave
- 2738 Depriest Ave
- 2712 Depriest Ave
- 2807 Walton Rd
- 2803 Walton Rd
- 2811 Walton Rd
- 2708 Depriest Ave
- 2815 Walton Rd
- 2711 Walton Rd