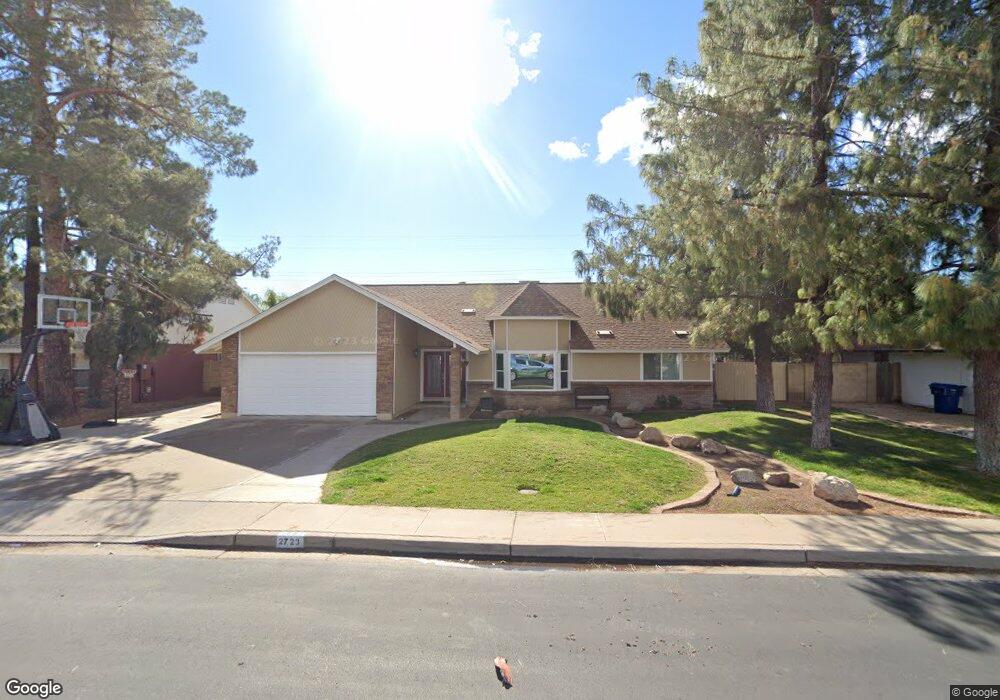
2723 E Des Moines St Mesa, AZ 85213
North Central Mesa NeighborhoodEstimated Value: $498,878 - $550,000
4
Beds
2
Baths
2,223
Sq Ft
$235/Sq Ft
Est. Value
About This Home
This home is located at 2723 E Des Moines St, Mesa, AZ 85213 and is currently estimated at $523,470, approximately $235 per square foot. 2723 E Des Moines St is a home located in Maricopa County with nearby schools including Field Elementary School, Franklin at Brimhall Elementary School, and Franklin West Elementary School.
Ownership History
Date
Name
Owned For
Owner Type
Purchase Details
Closed on
Oct 7, 2025
Sold by
Christiansen Kevin and Christiansen Krysten
Bought by
Kmc Family Trust
Current Estimated Value
Purchase Details
Closed on
Nov 8, 2011
Sold by
Oliver Perry E and Oliver Joyce E
Bought by
Christiansen Kevin and Christiansen Krysten
Home Financials for this Owner
Home Financials are based on the most recent Mortgage that was taken out on this home.
Original Mortgage
$120,800
Interest Rate
3.95%
Mortgage Type
New Conventional
Purchase Details
Closed on
Apr 2, 1997
Sold by
Christensen Scott H and Christensen Cynthia
Bought by
Oliver Perry E and Oliver Joyce E
Home Financials for this Owner
Home Financials are based on the most recent Mortgage that was taken out on this home.
Original Mortgage
$102,000
Interest Rate
10.55%
Mortgage Type
New Conventional
Create a Home Valuation Report for This Property
The Home Valuation Report is an in-depth analysis detailing your home's value as well as a comparison with similar homes in the area
Home Values in the Area
Average Home Value in this Area
Purchase History
| Date | Buyer | Sale Price | Title Company |
|---|---|---|---|
| Kmc Family Trust | -- | None Listed On Document | |
| Christiansen Kevin | $151,000 | Stewart Title & Trust Of Pho | |
| Oliver Perry E | $120,000 | First American Title |
Source: Public Records
Mortgage History
| Date | Status | Borrower | Loan Amount |
|---|---|---|---|
| Previous Owner | Christiansen Kevin | $120,800 | |
| Previous Owner | Oliver Perry E | $102,000 |
Source: Public Records
Tax History
| Year | Tax Paid | Tax Assessment Tax Assessment Total Assessment is a certain percentage of the fair market value that is determined by local assessors to be the total taxable value of land and additions on the property. | Land | Improvement |
|---|---|---|---|---|
| 2025 | $1,527 | $18,381 | -- | -- |
| 2024 | $1,543 | $17,506 | -- | -- |
| 2023 | $1,543 | $33,030 | $6,600 | $26,430 |
| 2022 | $1,509 | $25,700 | $5,140 | $20,560 |
| 2021 | $1,551 | $24,710 | $4,940 | $19,770 |
| 2020 | $1,530 | $22,460 | $4,490 | $17,970 |
| 2019 | $1,417 | $20,370 | $4,070 | $16,300 |
| 2018 | $1,353 | $18,680 | $3,730 | $14,950 |
| 2017 | $1,311 | $17,460 | $3,490 | $13,970 |
| 2016 | $1,287 | $16,880 | $3,370 | $13,510 |
| 2015 | $1,215 | $12,830 | $2,560 | $10,270 |
Source: Public Records
Map
Nearby Homes
- 721 N 25th St
- 824 N York Cir
- 432 N Whiting
- 2458 E University Dr Unit 2
- 2416 E University Dr Unit 4
- 2435 E Evergreen St
- 2655 E Encanto St
- 3050 E Cicero St
- 2267 E Caballero Cir
- 2301 E Enrose St
- 3020 E Main St Unit G97
- 3020 E Main St Unit I-52
- 3020 E Main St Unit T82
- 2322 E Evergreen St
- 2419 E Billings St
- 2511 E Fountain St
- 2214 E Contessa Cir
- 303 N Lindsay Rd Unit O-8
- 303 N Lindsay Rd Unit W-13
- 303 N Lindsay Rd Unit I95
- 2711 E Des Moines St
- 2735 E Des Moines St
- 2726 E Decatur St
- 2714 E Decatur St
- 2738 E Decatur St
- 2728 E Des Moines St
- 2701 E Des Moines St
- 2716 E Des Moines St
- 628 N Yale
- 2702 E Decatur St
- 2750 E Decatur St
- 642 N Yale
- 618 N Yale
- 2704 E Des Moines St
- 2657 E Des Moines St
- 654 N Yale
- 2654 E Decatur St
- 2762 E Decatur St
- 2715 E Dartmouth St
- 2723 E Dartmouth St
Your Personal Tour Guide
Ask me questions while you tour the home.