Estimated Value: $272,380 - $300,000
--
Bed
2
Baths
1,807
Sq Ft
$161/Sq Ft
Est. Value
About This Home
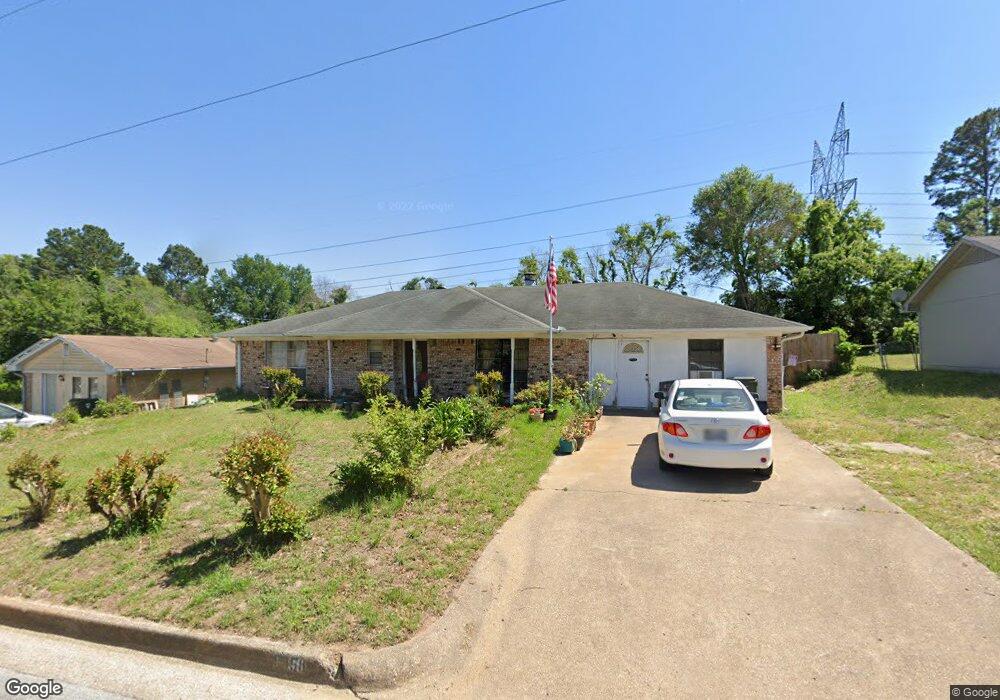
This home is located at 2723 Shady Bluff, Tyler, TX 75707 and is currently estimated at $291,595, approximately $161 per square foot. 2723 Shady Bluff is a home located in Smith County with nearby schools including Mozelle Brown Elementary School, J.W. Holloway Sixth Grade School, and Whitehouse High School.
Create a Home Valuation Report for This Property
The Home Valuation Report is an in-depth analysis detailing your home's value as well as a comparison with similar homes in the area
Home Values in the Area
Average Home Value in this Area
Tax History Compared to Growth
Tax History
| Year | Tax Paid | Tax Assessment Tax Assessment Total Assessment is a certain percentage of the fair market value that is determined by local assessors to be the total taxable value of land and additions on the property. | Land | Improvement |
|---|---|---|---|---|
| 2025 | $1,135 | $305,591 | $83,304 | $222,287 |
| 2024 | $1,135 | $252,294 | $42,000 | $236,819 |
| 2023 | $3,492 | $260,451 | $42,000 | $218,451 |
| 2022 | $3,637 | $213,656 | $31,680 | $181,976 |
| 2021 | $3,542 | $189,552 | $31,680 | $157,872 |
| 2020 | $3,377 | $174,958 | $31,680 | $143,278 |
| 2019 | $3,216 | $161,227 | $24,000 | $137,227 |
| 2018 | $3,033 | $152,970 | $24,000 | $128,970 |
| 2017 | $2,682 | $152,970 | $24,000 | $128,970 |
| 2016 | $2,649 | $151,106 | $24,000 | $127,106 |
| 2015 | $2,160 | $146,637 | $24,000 | $122,637 |
| 2014 | $2,160 | $140,937 | $24,000 | $116,937 |
Source: Public Records
Map
Nearby Homes
- 6223 Mesquite Dr
- 6136 Graemont Blvd
- 6039 Pine Cone Ln
- 6015 Pine Cone Ln
- 5906 Mesquite Dr
- 5905 Havens Trail
- 5841 Havens Trail
- 2020 Equestrian Ln
- 2015 Dressage Ln
- 3123 Oak Bend
- 5803 Persimmon Dr
- 5821 Thompson Place
- 5718 Gloucester Dr
- 3114 Arbor Oak Dr
- 7012 Hillside Ave
- 2512 Guinn Farms Rd
- 5623 Berkeley Dr
- 5401 Andover Dr
- 2531 Guinn Farms Rd
- 5832 Mustang Trail
- 2735 Shady Bluff
- 2711 Shady Bluff
- 2747 Shady Bluff
- 2641 2641 Shady Bluff
- 2747 2747 Shady Bluff
- 6246 Mesquite Dr
- 6247 Whispering Ln
- 2759 2759 Shady Bluff
- 2639 Shady Bluff
- 6234 Mesquite Dr
- 2759 Shady Bluff
- 6235 Whispering Ln
- 6247 Mesquite Dr
- 2627 Shady Bluff
- 2627 2627 Shady Bluff
- 6259 Whispering Ln
- 6222 Mesquite Dr
- 6222 6222 Mesquite
- 6235 Mesquite Dr
- 6223 Whispering Ln