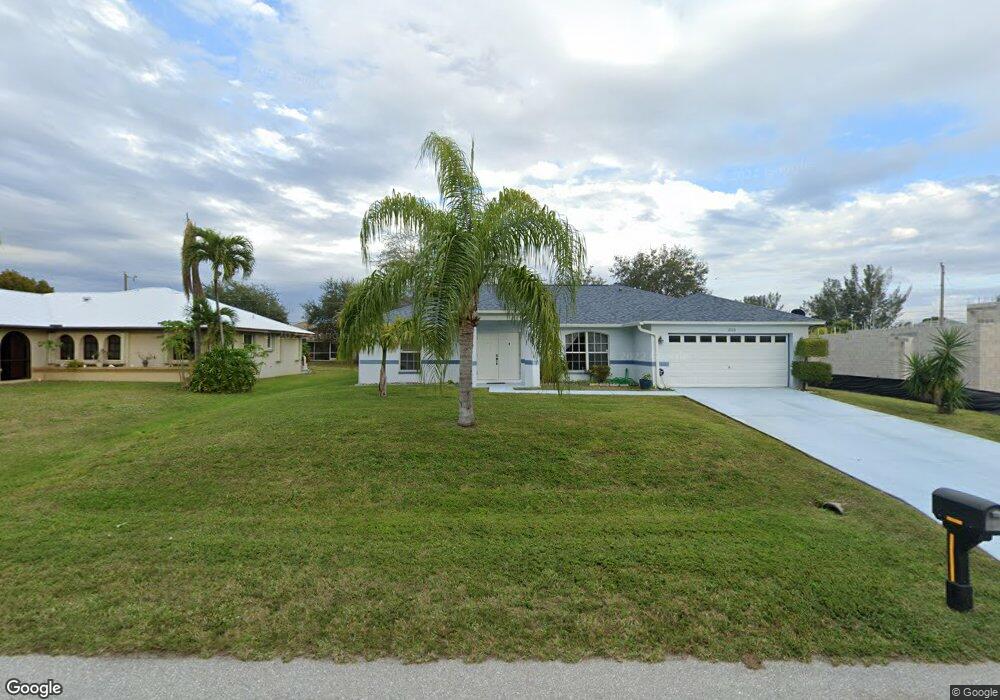
2723 SW 2nd Place Cape Coral, FL 33914
Pelican NeighborhoodEstimated Value: $377,287 - $418,000
3
Beds
2
Baths
1,777
Sq Ft
$227/Sq Ft
Est. Value
About This Home
This home is located at 2723 SW 2nd Place, Cape Coral, FL 33914 and is currently estimated at $403,822, approximately $227 per square foot. 2723 SW 2nd Place is a home located in Lee County with nearby schools including Cape Elementary School, Caloosa Elementary School, and Tropic Isles Elementary School.
Ownership History
Date
Name
Owned For
Owner Type
Purchase Details
Closed on
Dec 23, 2011
Sold by
Muir Peter
Bought by
Lawson Shirley A
Current Estimated Value
Home Financials for this Owner
Home Financials are based on the most recent Mortgage that was taken out on this home.
Original Mortgage
$100,000
Outstanding Balance
$68,571
Interest Rate
4.06%
Mortgage Type
New Conventional
Estimated Equity
$335,251
Purchase Details
Closed on
Apr 6, 2010
Sold by
Jones Tammy Dawn
Bought by
Muir Peter
Purchase Details
Closed on
May 22, 2006
Sold by
Edmonds Chad and Edmonds Brooke
Bought by
Jones Tammy Dawn
Home Financials for this Owner
Home Financials are based on the most recent Mortgage that was taken out on this home.
Original Mortgage
$222,400
Interest Rate
7.5%
Mortgage Type
Unknown
Purchase Details
Closed on
Apr 5, 2002
Sold by
1St Home Bldr Fl
Bought by
Edmonds Chad and Edmonds Brooke
Home Financials for this Owner
Home Financials are based on the most recent Mortgage that was taken out on this home.
Original Mortgage
$112,665
Interest Rate
6.89%
Mortgage Type
FHA
Create a Home Valuation Report for This Property
The Home Valuation Report is an in-depth analysis detailing your home's value as well as a comparison with similar homes in the area
Home Values in the Area
Average Home Value in this Area
Purchase History
| Date | Buyer | Sale Price | Title Company |
|---|---|---|---|
| Lawson Shirley A | $125,000 | Attorney | |
| Muir Peter | $93,700 | None Available | |
| Jones Tammy Dawn | $278,000 | Connection Title Llc | |
| Edmonds Chad | $138,500 | -- |
Source: Public Records
Mortgage History
| Date | Status | Borrower | Loan Amount |
|---|---|---|---|
| Open | Lawson Shirley A | $100,000 | |
| Previous Owner | Jones Tammy Dawn | $222,400 | |
| Previous Owner | Edmonds Chad | $112,665 |
Source: Public Records
Tax History Compared to Growth
Tax History
| Year | Tax Paid | Tax Assessment Tax Assessment Total Assessment is a certain percentage of the fair market value that is determined by local assessors to be the total taxable value of land and additions on the property. | Land | Improvement |
|---|---|---|---|---|
| 2025 | $3,597 | $159,201 | -- | -- |
| 2024 | $3,485 | $154,714 | -- | -- |
| 2023 | $3,485 | $150,208 | $0 | $0 |
| 2022 | $3,296 | $145,833 | $0 | $0 |
| 2021 | $3,308 | $227,795 | $32,033 | $195,762 |
| 2020 | $3,265 | $139,630 | $0 | $0 |
| 2019 | $3,196 | $136,491 | $0 | $0 |
| 2018 | $3,181 | $133,946 | $0 | $0 |
| 2017 | $3,153 | $131,191 | $0 | $0 |
| 2016 | $3,167 | $176,988 | $16,826 | $160,162 |
| 2015 | $3,173 | $164,296 | $11,976 | $152,320 |
| 2014 | -- | $140,588 | $7,298 | $133,290 |
| 2013 | -- | $124,716 | $4,837 | $119,879 |
Source: Public Records
Map
Nearby Homes
- 2716 SW 2nd Place
- 2712 SW 2nd Place
- 204 SW 28th St
- 2704 SW 2nd Place
- 2703 SW 2nd Ave
- 227 SW 28th Terrace
- 129 SW 28th Terrace
- 5214 SW 2nd Ave
- 234 SW 26th St
- 2614 SW Santa Barbara Place
- 2705 SW 4th Ave
- 2701 SW 4th Ave
- 2804 Santa Barbara Blvd
- 406 SW 28th St
- 322 SW 28th Terrace
- 2714 SW 4th Ave
- 314 SW 29th St
- 326 SW 29th St
- 2919/2921 SW Santa Barbara Place
- 113 SE 28th Terrace
- 2719 SW 2nd Place
- 2727 SW 2nd Place
- 2724 SW 2nd Ave
- 2720 SW 2nd Ave
- 2728 SW 2nd Ave
- 2715 SW 2nd Place
- 2726 SW 2nd Place
- 2716 SW 2nd Ave
- 2730 SW 2nd Place
- 2711 SW 2nd Place
- 210 SW 28th St
- 214 SW 28th St
- 2712 SW 2nd Ave Unit 45
- 2723 SW 2nd Ave
- 2719 SW 2nd Ave
- 2727 SW 2nd Ave
- 160 SW 28th St
- 2707 SW 2nd Place
- 156 SW 28th St
- 2708 SW 2nd Ave