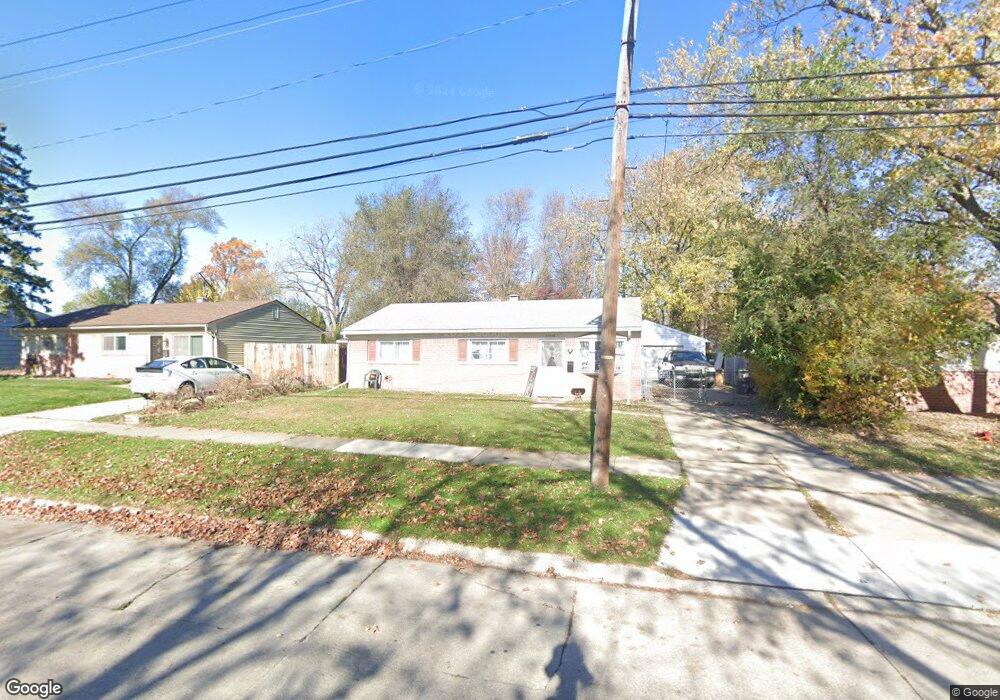
27236 Joan St Taylor, MI 48180
Estimated Value: $156,000 - $184,000
3
Beds
1
Bath
1,007
Sq Ft
$169/Sq Ft
Est. Value
About This Home
This home is located at 27236 Joan St, Taylor, MI 48180 and is currently estimated at $170,254, approximately $169 per square foot. 27236 Joan St is a home located in Wayne County with nearby schools including Holland Elementary School, Hoover Middle School, and Taylor High School.
Ownership History
Date
Name
Owned For
Owner Type
Purchase Details
Closed on
Mar 16, 2012
Sold by
Martin James
Bought by
James Martin Revocable Living Trust
Current Estimated Value
Purchase Details
Closed on
Mar 12, 2008
Sold by
Jefferson Christopher P
Bought by
Citimortgage Inc
Purchase Details
Closed on
Apr 17, 2006
Sold by
Property Investments Unlimited Llc
Bought by
Jefferson Christopher P
Purchase Details
Closed on
Oct 25, 2005
Sold by
Fannie Mae
Bought by
Property Investments Unlimited Llc
Purchase Details
Closed on
Feb 9, 2005
Sold by
Mortgage Electronic Registration Systems
Bought by
Federal National Mortgage Association
Purchase Details
Closed on
Jan 5, 2005
Sold by
Finstrom Robert M and Finstrom Angela A
Bought by
Mortgage Electronic Registration Systems
Purchase Details
Closed on
Nov 15, 1999
Sold by
Nickell Carrie A
Bought by
Finstrom Robert M
Purchase Details
Closed on
Jun 21, 1995
Sold by
Michael J Hayes
Bought by
Carrie Ann Nickell
Create a Home Valuation Report for This Property
The Home Valuation Report is an in-depth analysis detailing your home's value as well as a comparison with similar homes in the area
Home Values in the Area
Average Home Value in this Area
Purchase History
| Date | Buyer | Sale Price | Title Company |
|---|---|---|---|
| James Martin Revocable Living Trust | -- | None Available | |
| Citimortgage Inc | $38,252 | None Available | |
| Jefferson Christopher P | $129,000 | Land Owners Title Agency | |
| Property Investments Unlimited Llc | $84,900 | None Available | |
| Federal National Mortgage Association | -- | -- | |
| Mortgage Electronic Registration Systems | $121,539 | -- | |
| Finstrom Robert M | $88,000 | -- | |
| Carrie Ann Nickell | $53,000 | -- |
Source: Public Records
Tax History
| Year | Tax Paid | Tax Assessment Tax Assessment Total Assessment is a certain percentage of the fair market value that is determined by local assessors to be the total taxable value of land and additions on the property. | Land | Improvement |
|---|---|---|---|---|
| 2025 | $2,178 | $74,900 | $0 | $0 |
| 2024 | $2,115 | $69,600 | $0 | $0 |
| 2023 | $2,394 | $60,300 | $0 | $0 |
| 2022 | $1,989 | $57,500 | $0 | $0 |
| 2021 | $2,136 | $49,600 | $0 | $0 |
| 2020 | $2,113 | $43,900 | $0 | $0 |
| 2019 | $209,763 | $38,700 | $0 | $0 |
| 2018 | $1,746 | $29,700 | $0 | $0 |
| 2017 | $3,367 | $29,600 | $0 | $0 |
| 2016 | $2,037 | $28,700 | $0 | $0 |
| 2015 | $2,770 | $27,700 | $0 | $0 |
| 2013 | $2,770 | $28,800 | $0 | $0 |
| 2012 | $1,848 | $28,100 | $7,900 | $20,200 |
Source: Public Records
Map
Nearby Homes
- 6211 Inkster Rd
- 27029 Michelle Ct
- 5940 Daniels St
- 6198 Princess St
- 6144 Princess St
- 5970 John Daly St
- 5993 John Daly St
- 26424 Beverly Rd
- 27620 Newcastle St
- 6310 Duncan St
- 5132 S Inkster Rd
- 6005 Frederick St Unit 56
- 0 Ecorse Service Rd
- 26215 Beverly Rd
- 6008 E Maple Unit 110
- 26532 Powers Ave
- 6179 Fellrath St
- 0 Ecorse Rd Unit 20251029385
- 5926 Esther St
- 28176 Ecorse Rd
- 27224 Joan St
- 27248 Joan St
- 27212 Joan St
- 27260 Joan St Unit Bldg-Unit
- 27260 Joan St
- 6170 Wellington St
- 27215 Joan St
- 27223 Joan St
- 27249 Joan St
- 6160 Wellington St
- 27211 Joan St
- 27259 Joan St
- 6224 Wellington St
- 6140 Wellington St
- 27350 Joan St
- 27370 Joan St
- 6191 Inkster Rd
- 6169 Wellington St
- 6163 Inkster Rd
- 6120 Wellington St