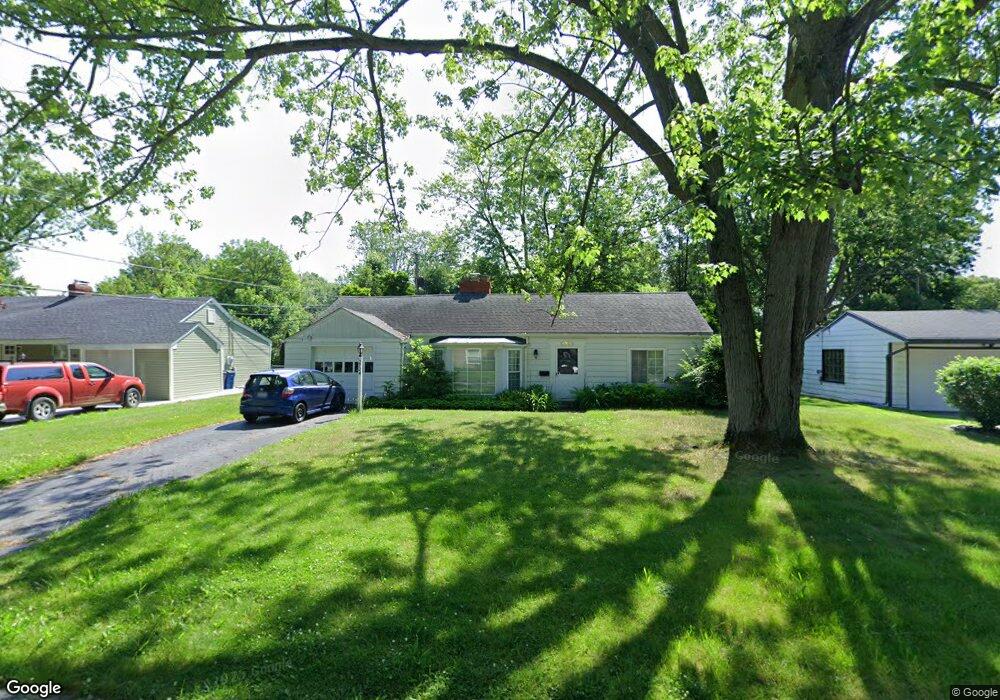
2724 E Rockridge Cir Toledo, OH 43606
Westgate NeighborhoodEstimated Value: $162,000 - $186,000
2
Beds
1
Bath
1,016
Sq Ft
$170/Sq Ft
Est. Value
About This Home
This home is located at 2724 E Rockridge Cir, Toledo, OH 43606 and is currently estimated at $172,694, approximately $169 per square foot. 2724 E Rockridge Cir is a home located in Lucas County with nearby schools including Monac Elementary School, Jefferson Junior High School, and Washington Junior High School.
Ownership History
Date
Name
Owned For
Owner Type
Purchase Details
Closed on
Jul 31, 2009
Sold by
Kampfer William N and Kampfer Konnie L
Bought by
Phillips Andrew S
Current Estimated Value
Purchase Details
Closed on
Aug 14, 2003
Sold by
Perry L Tom
Bought by
Kampfer William N
Home Financials for this Owner
Home Financials are based on the most recent Mortgage that was taken out on this home.
Original Mortgage
$91,753
Interest Rate
5.25%
Mortgage Type
Purchase Money Mortgage
Purchase Details
Closed on
Sep 28, 1998
Sold by
Warren Richard R and Warren Elizabeth A
Bought by
Perry L Tom
Home Financials for this Owner
Home Financials are based on the most recent Mortgage that was taken out on this home.
Original Mortgage
$63,440
Interest Rate
6.98%
Purchase Details
Closed on
Oct 15, 1993
Sold by
Warren Elizabeth Ann
Create a Home Valuation Report for This Property
The Home Valuation Report is an in-depth analysis detailing your home's value as well as a comparison with similar homes in the area
Home Values in the Area
Average Home Value in this Area
Purchase History
| Date | Buyer | Sale Price | Title Company |
|---|---|---|---|
| Phillips Andrew S | $70,000 | Attorney | |
| Kampfer William N | $91,800 | Metro Title Agency Inc | |
| Perry L Tom | $79,300 | -- | |
| -- | -- | -- |
Source: Public Records
Mortgage History
| Date | Status | Borrower | Loan Amount |
|---|---|---|---|
| Previous Owner | Kampfer William N | $91,753 | |
| Previous Owner | Perry L Tom | $63,440 |
Source: Public Records
Tax History Compared to Growth
Tax History
| Year | Tax Paid | Tax Assessment Tax Assessment Total Assessment is a certain percentage of the fair market value that is determined by local assessors to be the total taxable value of land and additions on the property. | Land | Improvement |
|---|---|---|---|---|
| 2024 | $1,313 | $42,210 | $10,185 | $32,025 |
| 2023 | $2,419 | $33,110 | $9,345 | $23,765 |
| 2022 | $2,414 | $33,110 | $9,345 | $23,765 |
| 2021 | $2,452 | $33,110 | $9,345 | $23,765 |
| 2020 | $2,356 | $27,160 | $7,630 | $19,530 |
| 2019 | $2,285 | $27,160 | $7,630 | $19,530 |
| 2018 | $2,075 | $27,160 | $7,630 | $19,530 |
| 2017 | $2,045 | $24,850 | $7,315 | $17,535 |
| 2016 | $2,053 | $71,000 | $20,900 | $50,100 |
| 2015 | $2,049 | $71,000 | $20,900 | $50,100 |
| 2014 | $1,694 | $24,860 | $7,320 | $17,540 |
| 2013 | $1,694 | $24,860 | $7,320 | $17,540 |
Source: Public Records
Map
Nearby Homes
- 2823 Wicklow Rd
- 2810 Evergreen Rd
- 2918 Evergreen Rd
- 2932 Evergreen Rd
- 3408 Christie Blvd
- 3765 Brookside Rd
- 3225 Kenwood Blvd
- 3329 Darlington Rd
- 2824 Secor Rd
- 2550 Secor Rd
- 4028 Brookside Rd
- 3844 W Central Ave
- 3205 Orchard Trail Dr
- 2324 Secor Rd
- 4132 Sheraton Rd
- 4146 Northmoor Rd
- 2929 Meadowwood Dr
- 3010 W Central Ave Unit 308
- 3614 Edgevale Rd
- 2541 Goddard Rd
- 2732 E Rockridge Cir
- 2716 E Rockridge Cir
- 2717 Wicklow Rd
- 2736 E Rockridge Cir
- 2708 E Rockridge Cir
- 2711 Wicklow Rd
- 2735 Wicklow Rd
- 2721 E Rockridge Cir
- 2729 E Rockridge Cir
- 2703 Wicklow Rd
- 2705 E Rockridge Cir
- 2801 Wicklow Rd
- 2802 E Rockridge Cir
- 2735 E Rockridge Cir
- 2636 E Rockridge Cir
- 2637 Wicklow Rd
- 2635 E Rockridge Cir
- 2805 E Rockridge Cir
- 2809 Wicklow Rd
- 2808 E Rockridge Cir