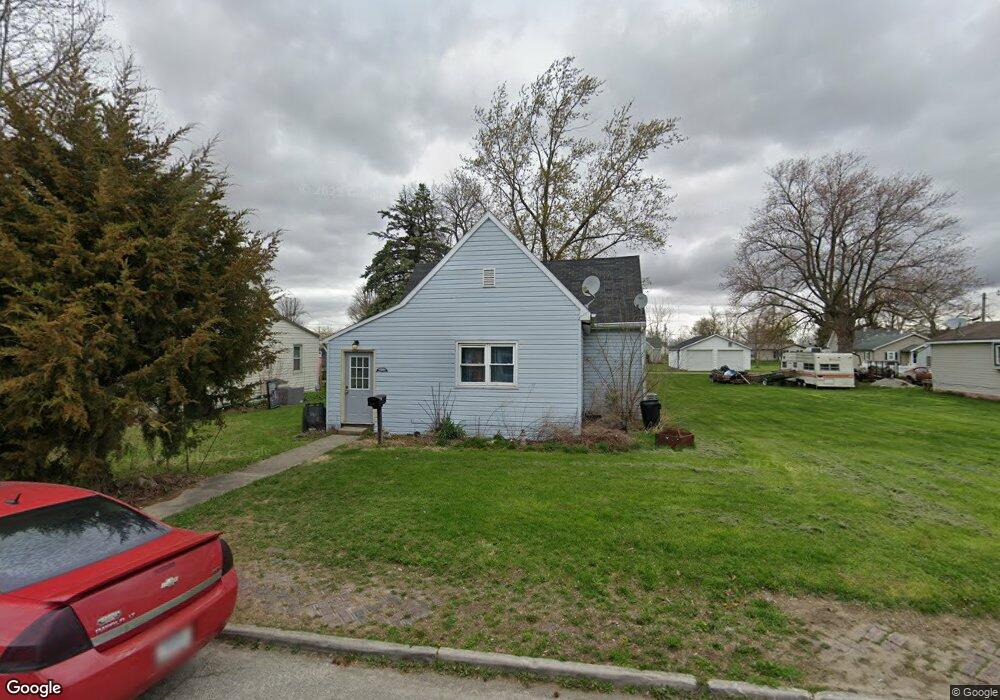
2724 N A St Elwood, IN 46036
Estimated Value: $102,000 - $151,000
3
Beds
1
Bath
1,156
Sq Ft
$109/Sq Ft
Est. Value
About This Home
This home is located at 2724 N A St, Elwood, IN 46036 and is currently estimated at $125,597, approximately $108 per square foot. 2724 N A St is a home located in Madison County with nearby schools including Elwood Elementary School, Elwood Intermediate School, and Elwood Junior-Senior High School.
Ownership History
Date
Name
Owned For
Owner Type
Purchase Details
Closed on
Dec 13, 2019
Sold by
Ovation 1 Llc
Bought by
Mcdaniel Richard
Current Estimated Value
Purchase Details
Closed on
Sep 29, 2016
Sold by
Tax Ease Florida Reo Llc
Bought by
Ovation Reo 1 Llc
Purchase Details
Closed on
Dec 20, 2013
Sold by
Madison County Auditor
Bought by
Tax Ease Florida Reo Llc
Purchase Details
Closed on
Jul 17, 2007
Sold by
Blue Spruce Entities Llc
Bought by
Noah Land Llc
Purchase Details
Closed on
Feb 6, 2007
Sold by
Devore Juanita
Bought by
Wells Fargo Bank Nationalassociation
Create a Home Valuation Report for This Property
The Home Valuation Report is an in-depth analysis detailing your home's value as well as a comparison with similar homes in the area
Home Values in the Area
Average Home Value in this Area
Purchase History
| Date | Buyer | Sale Price | Title Company |
|---|---|---|---|
| Mcdaniel Richard | -- | None Available | |
| Ovation Reo 1 Llc | -- | -- | |
| Tax Ease Florida Reo Llc | $1,897 | -- | |
| Noah Land Llc | -- | -- | |
| Wells Fargo Bank Nationalassociation | -- | -- |
Source: Public Records
Tax History Compared to Growth
Tax History
| Year | Tax Paid | Tax Assessment Tax Assessment Total Assessment is a certain percentage of the fair market value that is determined by local assessors to be the total taxable value of land and additions on the property. | Land | Improvement |
|---|---|---|---|---|
| 2024 | -- | $61,100 | $5,700 | $55,400 |
| 2023 | -- | $55,900 | $5,500 | $50,400 |
| 2022 | $10 | $55,600 | $5,200 | $50,400 |
| 2021 | $0 | $51,400 | $5,200 | $46,200 |
| 2020 | $0 | $49,000 | $4,900 | $44,100 |
| 2019 | $964 | $47,700 | $4,900 | $42,800 |
| 2018 | $2,414 | $44,800 | $4,900 | $39,900 |
| 2017 | $888 | $44,400 | $4,900 | $39,500 |
| 2016 | $805 | $40,000 | $4,900 | $35,100 |
| 2014 | $814 | $40,300 | $4,900 | $35,400 |
| 2013 | $814 | $40,300 | $4,900 | $35,400 |
Source: Public Records
Map
Nearby Homes