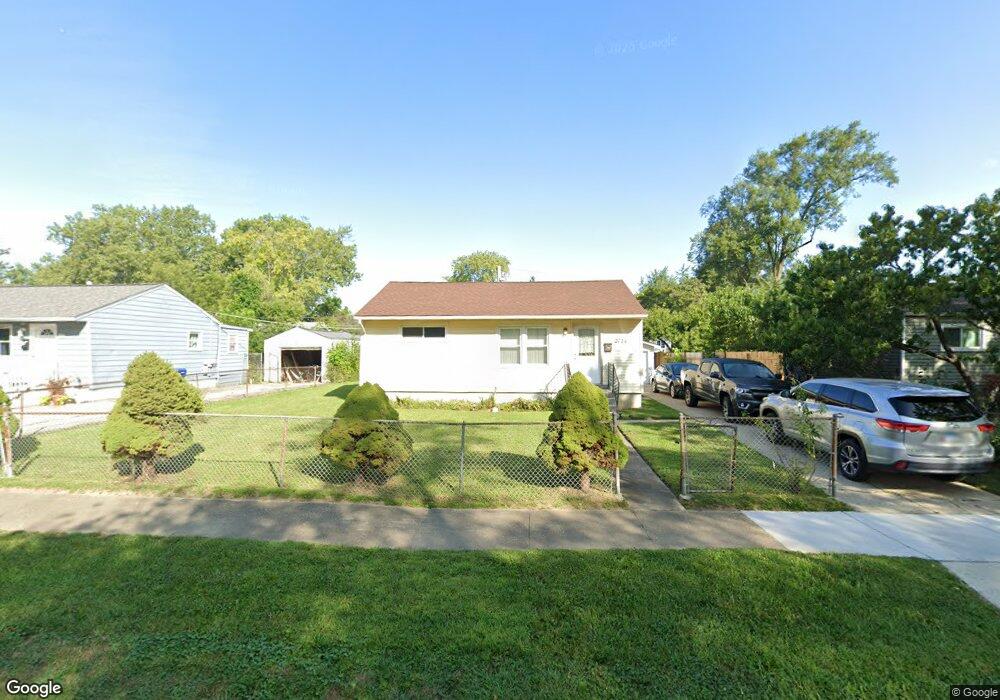
2724 N Butrick St Waukegan, IL 60087
Lake County Gardens NeighborhoodEstimated Value: $192,000 - $212,550
2
Beds
1
Bath
768
Sq Ft
$267/Sq Ft
Est. Value
About This Home
This home is located at 2724 N Butrick St, Waukegan, IL 60087 and is currently estimated at $204,888, approximately $266 per square foot. 2724 N Butrick St is a home located in Lake County with nearby schools including Little Fort Elementary School, Jack Benny Middle School, and Waukegan High School.
Ownership History
Date
Name
Owned For
Owner Type
Purchase Details
Closed on
Aug 11, 2009
Sold by
Secretary Of Housing & Urban Development
Bought by
Mendez Emma L
Current Estimated Value
Home Financials for this Owner
Home Financials are based on the most recent Mortgage that was taken out on this home.
Original Mortgage
$51,587
Outstanding Balance
$33,772
Interest Rate
5.29%
Mortgage Type
FHA
Estimated Equity
$171,116
Purchase Details
Closed on
Sep 18, 2008
Sold by
Flores
Bought by
Hud
Purchase Details
Closed on
May 1, 2001
Sold by
Bandman Arthur W and Bandman Carol J
Bought by
Flores Jorge and Beltran Luz C
Home Financials for this Owner
Home Financials are based on the most recent Mortgage that was taken out on this home.
Original Mortgage
$101,691
Interest Rate
7.02%
Mortgage Type
FHA
Purchase Details
Closed on
Nov 4, 1998
Sold by
Bandman Arthur W and Bandman Carol
Bought by
Bandman Arthur W and Bandman Carol J
Create a Home Valuation Report for This Property
The Home Valuation Report is an in-depth analysis detailing your home's value as well as a comparison with similar homes in the area
Home Values in the Area
Average Home Value in this Area
Purchase History
| Date | Buyer | Sale Price | Title Company |
|---|---|---|---|
| Mendez Emma L | -- | Stewart Title Company | |
| Hud | -- | None Available | |
| Flores Jorge | $103,500 | -- | |
| Bandman Arthur W | -- | -- |
Source: Public Records
Mortgage History
| Date | Status | Borrower | Loan Amount |
|---|---|---|---|
| Open | Mendez Emma L | $51,587 | |
| Previous Owner | Flores Jorge | $101,691 |
Source: Public Records
Tax History Compared to Growth
Tax History
| Year | Tax Paid | Tax Assessment Tax Assessment Total Assessment is a certain percentage of the fair market value that is determined by local assessors to be the total taxable value of land and additions on the property. | Land | Improvement |
|---|---|---|---|---|
| 2024 | $4,821 | $56,596 | $8,678 | $47,918 |
| 2023 | $4,189 | $51,127 | $7,839 | $43,288 |
| 2022 | $4,189 | $42,847 | $7,468 | $35,379 |
| 2021 | $3,904 | $37,446 | $6,466 | $30,980 |
| 2020 | $3,955 | $34,886 | $6,024 | $28,862 |
| 2019 | $3,980 | $31,967 | $5,520 | $26,447 |
| 2018 | $3,380 | $26,143 | $7,030 | $19,113 |
| 2017 | $3,290 | $23,130 | $6,220 | $16,910 |
| 2016 | $3,106 | $20,099 | $5,405 | $14,694 |
| 2015 | $3,039 | $17,989 | $4,838 | $13,151 |
| 2014 | $3,275 | $19,356 | $5,310 | $14,046 |
| 2012 | $4,058 | $20,970 | $5,753 | $15,217 |
Source: Public Records
Map
Nearby Homes
- 1612 Whitney St
- 1636 Rice St
- 2613 N Lewis Ave
- 2350 N Lewis Ave
- 2232 Walnut St
- 3211 Rugby Ct
- 37905 N Loyola Ave
- 301 W Eagle Ct
- 37966 N Cornell Rd
- 0 Traditions Dr
- 3411 N Lewis Ave
- 38127 N Shore Ave
- 38362 N Manor Ave
- 3101 Country Club Ln
- 2708 Dana Ave
- 2705 Dana Ave
- 10241 W Bairstow Ave
- 1905 Linden Ave
- 2713 Varonen Ave
- 12312 W Audrey Ave
- 2720 N Butrick St
- 2728 N Butrick St
- 2725 Yeoman St
- 2729 Yeoman St
- 2716 N Butrick St
- 2732 N Butrick St
- 2721 Yeoman St
- 2733 Yeoman St
- 2721 N Butrick St
- 2717 N Butrick St
- 2717 Yeoman St
- 2713 N Butrick St
- 2725 N Butrick St
- 2712 N Butrick St
- 2736 N Butrick St
- 1509 Ferry St
- 2729 N Butrick St
- 2709 N Butrick St
- 2737 Yeoman St
- 2713 Yeoman St