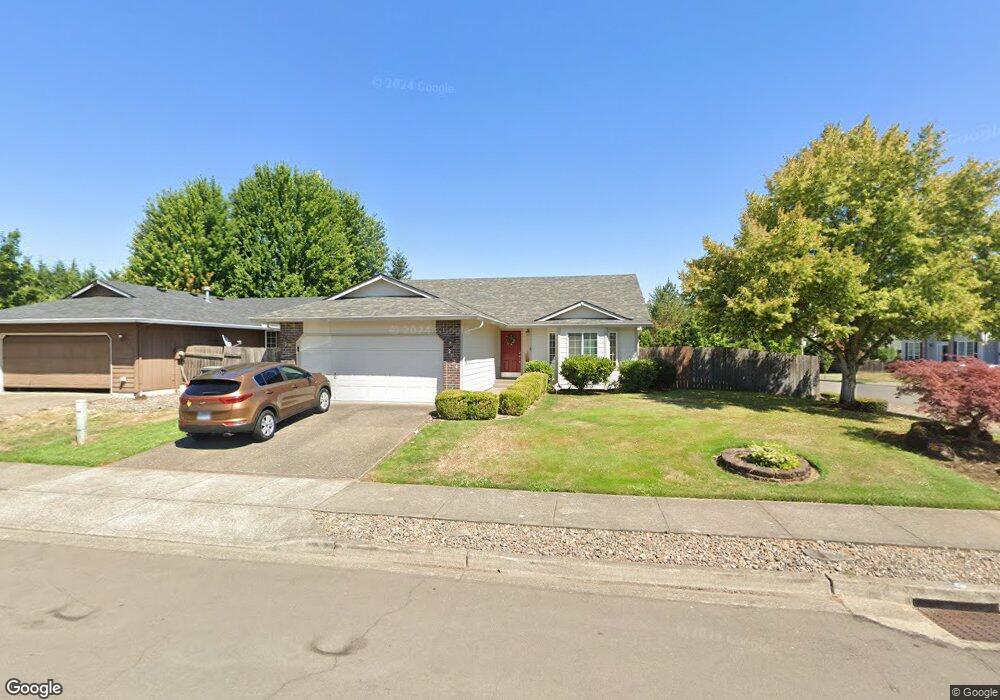
2724 NE Kaster Dr Hillsboro, OR 97124
Northwest Hillsboro NeighborhoodEstimated Value: $528,000 - $545,000
3
Beds
2
Baths
1,550
Sq Ft
$344/Sq Ft
Est. Value
About This Home
This home is located at 2724 NE Kaster Dr, Hillsboro, OR 97124 and is currently estimated at $533,900, approximately $344 per square foot. 2724 NE Kaster Dr is a home located in Washington County with nearby schools including Paul L. Patterson Elementary School, Evergreen Jr High School, and Glencoe High School.
Ownership History
Date
Name
Owned For
Owner Type
Purchase Details
Closed on
Jun 5, 2012
Sold by
Renshaw David and Renshaw Heather C A
Bought by
Vandyke Gary T and Vandyke Kimberly A
Current Estimated Value
Purchase Details
Closed on
Apr 20, 2004
Sold by
Virden Dale C and Virden Lori L
Bought by
Renshaw David and Renshaw Heather C A
Home Financials for this Owner
Home Financials are based on the most recent Mortgage that was taken out on this home.
Original Mortgage
$151,616
Interest Rate
4.37%
Mortgage Type
Unknown
Purchase Details
Closed on
Dec 23, 1997
Sold by
Vancleve Paula M and Vancleve Douglas E
Bought by
Virden Dale C and Virden Lori L
Home Financials for this Owner
Home Financials are based on the most recent Mortgage that was taken out on this home.
Original Mortgage
$135,450
Interest Rate
7.25%
Purchase Details
Closed on
Jul 24, 1995
Sold by
Riverside Homes Inc
Bought by
Vancleve Paula M and Vancleve Douglas E
Home Financials for this Owner
Home Financials are based on the most recent Mortgage that was taken out on this home.
Original Mortgage
$126,600
Interest Rate
7.62%
Mortgage Type
FHA
Create a Home Valuation Report for This Property
The Home Valuation Report is an in-depth analysis detailing your home's value as well as a comparison with similar homes in the area
Home Values in the Area
Average Home Value in this Area
Purchase History
| Date | Buyer | Sale Price | Title Company |
|---|---|---|---|
| Vandyke Gary T | $211,900 | First American | |
| Renshaw David | $189,520 | Transnation Title Agency Or | |
| Virden Dale C | $150,500 | Fidelity National Title Co | |
| Vancleve Paula M | $127,950 | Chicago Title Insurance Co |
Source: Public Records
Mortgage History
| Date | Status | Borrower | Loan Amount |
|---|---|---|---|
| Previous Owner | Renshaw David | $151,616 | |
| Previous Owner | Virden Dale C | $135,450 | |
| Previous Owner | Vancleve Paula M | $126,600 | |
| Closed | Renshaw David | $37,904 |
Source: Public Records
Tax History Compared to Growth
Tax History
| Year | Tax Paid | Tax Assessment Tax Assessment Total Assessment is a certain percentage of the fair market value that is determined by local assessors to be the total taxable value of land and additions on the property. | Land | Improvement |
|---|---|---|---|---|
| 2025 | $4,448 | $272,110 | -- | -- |
| 2024 | $4,321 | $264,190 | -- | -- |
| 2023 | $4,321 | $256,500 | $0 | $0 |
| 2022 | $4,204 | $256,500 | $0 | $0 |
| 2021 | $4,120 | $241,780 | $0 | $0 |
| 2020 | $4,031 | $234,740 | $0 | $0 |
| 2019 | $3,915 | $227,910 | $0 | $0 |
| 2018 | $3,748 | $221,280 | $0 | $0 |
| 2017 | $3,612 | $214,840 | $0 | $0 |
| 2016 | $3,513 | $208,590 | $0 | $0 |
| 2015 | $3,371 | $202,520 | $0 | $0 |
| 2014 | $3,352 | $196,630 | $0 | $0 |
Source: Public Records
Map
Nearby Homes
- 2878 NE Aurora Dr
- 3215 NE 4th Ave
- 2643 NE 2nd Dr
- 3166 NE Glencoe Oaks Place
- 2795 NE Lorie Dr
- 175 NE Chancellor Ct
- 2011 NE Josephine Dr
- 729 NE Rogahn St
- 3968 NW 3rd Ave
- 802 NE Brennan Ln
- 795 NE Rogahn St
- 895 NE Addison Ct
- 1676 NE 2nd Ave
- 2619 NE Charlois Dr
- 1900 NE Harewood Place
- 2525 NE Charlois Dr
- 886 NE Creeksedge Dr
- 555 NW Hertel St
- 773 NE Kathryn St
- 1706 NW 8th Ave
- 2768 NE Kaster Dr
- 321 NE Lenox St
- 0 NE Lenox St Unit 4060710
- 2702 NE 3rd Ct
- 295 NE Lenox St
- 2812 NE Kaster Dr
- 339 NE Lenox St
- 322 NE Lenox St
- 298 NE Tralee Ct
- 302 NE Lauren Ct
- 2705 NE 3rd Ct
- 291 NE Lenox St
- 2696 NE 3rd Ct
- 2856 NE Kaster Dr
- 2713 NE 3rd Place
- 294 NE Tralee Ct
- 314 NE Lauren Ct
- 355 NE Lenox St
- 2693 NE 3rd Ct
- 287 NE Lenox St