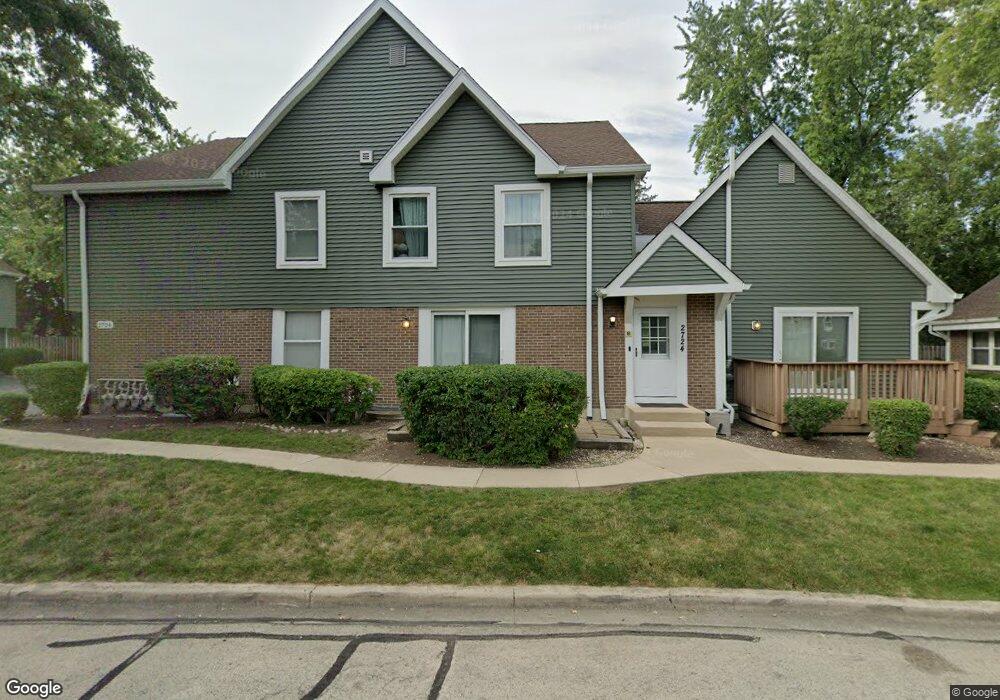
2724 Weeping Willow Dr Unit 3B Lisle, IL 60532
Huntington Hill NeighborhoodEstimated Value: $295,000 - $297,000
2
Beds
2
Baths
1,092
Sq Ft
$271/Sq Ft
Est. Value
About This Home
This home is located at 2724 Weeping Willow Dr Unit 3B, Lisle, IL 60532 and is currently estimated at $295,791, approximately $270 per square foot. 2724 Weeping Willow Dr Unit 3B is a home located in DuPage County with nearby schools including Steeple Run Elementary School, Kennedy Junior High School, and Naperville North High School.
Ownership History
Date
Name
Owned For
Owner Type
Purchase Details
Closed on
Jul 21, 2017
Sold by
Skrocki Daniel J and Skrocki Stacey M
Bought by
Montalbano Amy and Montalbano Vincent
Current Estimated Value
Home Financials for this Owner
Home Financials are based on the most recent Mortgage that was taken out on this home.
Original Mortgage
$166,429
Outstanding Balance
$141,838
Interest Rate
4.87%
Mortgage Type
FHA
Estimated Equity
$153,953
Purchase Details
Closed on
Apr 25, 2008
Sold by
Laberta Albert J
Bought by
Skrocki Daniel J and Stevens Stacey M
Home Financials for this Owner
Home Financials are based on the most recent Mortgage that was taken out on this home.
Original Mortgage
$177,493
Interest Rate
6.57%
Mortgage Type
FHA
Purchase Details
Closed on
Nov 21, 2000
Sold by
Laberta Marge H
Bought by
Laberta Albert J and Laberta Joyce
Create a Home Valuation Report for This Property
The Home Valuation Report is an in-depth analysis detailing your home's value as well as a comparison with similar homes in the area
Home Values in the Area
Average Home Value in this Area
Purchase History
| Date | Buyer | Sale Price | Title Company |
|---|---|---|---|
| Montalbano Amy | -- | First American Title | |
| Skrocki Daniel J | $180,000 | Law Title Insurance | |
| Laberta Albert J | -- | -- |
Source: Public Records
Mortgage History
| Date | Status | Borrower | Loan Amount |
|---|---|---|---|
| Open | Montalbano Amy | $166,429 | |
| Previous Owner | Skrocki Daniel J | $177,493 |
Source: Public Records
Tax History Compared to Growth
Tax History
| Year | Tax Paid | Tax Assessment Tax Assessment Total Assessment is a certain percentage of the fair market value that is determined by local assessors to be the total taxable value of land and additions on the property. | Land | Improvement |
|---|---|---|---|---|
| 2024 | $5,261 | $81,926 | $12,546 | $69,380 |
| 2023 | $5,057 | $74,770 | $11,450 | $63,320 |
| 2022 | $4,427 | $65,020 | $9,960 | $55,060 |
| 2021 | $4,288 | $62,560 | $9,580 | $52,980 |
| 2020 | $4,190 | $61,440 | $9,410 | $52,030 |
| 2019 | $4,059 | $58,780 | $9,000 | $49,780 |
| 2018 | $3,879 | $56,240 | $8,610 | $47,630 |
| 2017 | $4,275 | $54,340 | $8,320 | $46,020 |
| 2016 | $4,215 | $52,380 | $8,020 | $44,360 |
| 2015 | $4,188 | $49,320 | $7,550 | $41,770 |
| 2014 | $4,211 | $48,590 | $7,440 | $41,150 |
| 2013 | $4,713 | $55,360 | $8,480 | $46,880 |
Source: Public Records
Map
Nearby Homes
- 2783 Wayfaring Ln Unit 14B
- 2732 Weeping Willow Dr Unit B
- 6142 Ivy Dr
- 24W681 Woodcrest Dr
- 32 Westmoreland Ln
- 210 Westmoreland Ln
- 3 Westmoreland Ln
- 25W257 Gunston Ave
- 6S018 Steeple Run Dr Unit 6S018
- 1386 Old Dominion Ct
- 5S761 Malibu Ln
- 5S730 Malibu Ln
- 5S661 Buttonwood Ct
- 5800 Oakwood Dr Unit B-28
- 5820 Oakwood Dr Unit 1A
- 5830 Oakwood Dr Unit 4F
- 5810 Oakwood Dr Unit A-50
- 1133 Catherine Ave
- 6551 Shagbark Ct Unit 2
- 1314 Haverhill Cir
- 2724 Weeping Willow Dr Unit 3A
- 2724 Weeping Willow Dr Unit C
- 2724 Weeping Willow Dr Unit 3D
- 2724 Weeping Willow Dr Unit B
- 2751 Wayfaring Ln Unit D
- 2751 Wayfaring Ln Unit A
- 2751 Wayfaring Ln Unit B
- 2751 Wayfaring Ln Unit C
- 2751 Wayfaring Ln Unit 18D
- 2743 Wayfaring Ln Unit 19C
- 2743 Wayfaring Ln Unit 19B
- 2743 Wayfaring Ln Unit C
- 2743 Wayfaring Ln Unit 19D
- 2743 Wayfaring Ln Unit 19A
- 2743 Wayfaring Ln Unit B
- 2743 Wayfaring Ln
- 2712 Shellingham Dr
- 2744 Wayfaring Ln Unit C
- 2744 Wayfaring Ln Unit D
- 2744 Wayfaring Ln Unit A