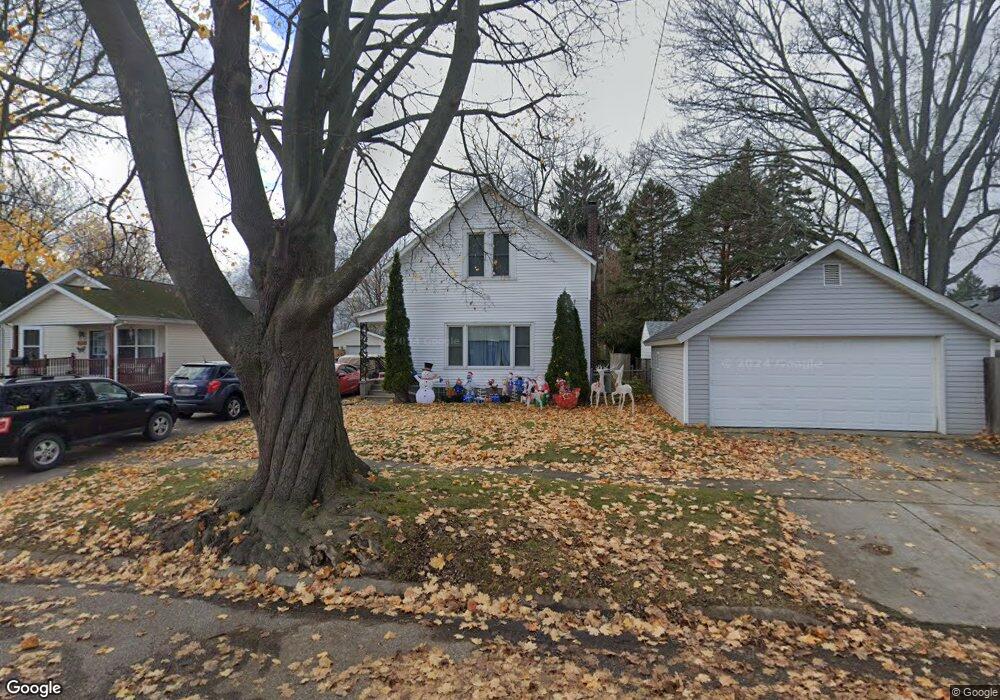
2725 Maple St Port Huron, MI 48060
Estimated Value: $154,712 - $182,000
4
Beds
1
Bath
1,685
Sq Ft
$101/Sq Ft
Est. Value
About This Home
This home is located at 2725 Maple St, Port Huron, MI 48060 and is currently estimated at $170,928, approximately $101 per square foot. 2725 Maple St is a home located in St. Clair County with nearby schools including Garfield Elementary School, Holland Woods Middle School, and Port Huron Northern High School.
Ownership History
Date
Name
Owned For
Owner Type
Purchase Details
Closed on
Jan 20, 2010
Sold by
Bauer Robert and Bauer Dina
Bought by
R & D Legacy Llc
Current Estimated Value
Purchase Details
Closed on
Aug 12, 2006
Sold by
Jp Morgan Chase Bank
Bought by
Bauer Robert and Bauer Dina
Home Financials for this Owner
Home Financials are based on the most recent Mortgage that was taken out on this home.
Original Mortgage
$82,000
Interest Rate
6.78%
Mortgage Type
Future Advance Clause Open End Mortgage
Purchase Details
Closed on
Oct 21, 2005
Sold by
Walters Darlene J and Walters Matthew J
Bought by
Jpmorgan Chase Bank
Create a Home Valuation Report for This Property
The Home Valuation Report is an in-depth analysis detailing your home's value as well as a comparison with similar homes in the area
Home Values in the Area
Average Home Value in this Area
Purchase History
| Date | Buyer | Sale Price | Title Company |
|---|---|---|---|
| R & D Legacy Llc | -- | None Available | |
| Bauer Robert | $74,000 | First American Title Ins Co | |
| Jpmorgan Chase Bank | -- | None Available |
Source: Public Records
Mortgage History
| Date | Status | Borrower | Loan Amount |
|---|---|---|---|
| Previous Owner | Bauer Robert | $82,000 |
Source: Public Records
Tax History Compared to Growth
Tax History
| Year | Tax Paid | Tax Assessment Tax Assessment Total Assessment is a certain percentage of the fair market value that is determined by local assessors to be the total taxable value of land and additions on the property. | Land | Improvement |
|---|---|---|---|---|
| 2025 | $2,092 | $69,900 | $0 | $0 |
| 2024 | $1,823 | $65,000 | $0 | $0 |
| 2023 | $1,726 | $58,000 | $0 | $0 |
| 2022 | $1,718 | $49,700 | $0 | $0 |
| 2021 | $1,641 | $45,800 | $0 | $0 |
| 2020 | $1,647 | $42,700 | $42,700 | $0 |
| 2019 | $1,618 | $29,300 | $0 | $0 |
| 2018 | $1,582 | $29,300 | $0 | $0 |
| 2017 | $1,500 | $27,200 | $0 | $0 |
| 2016 | $1,290 | $27,200 | $0 | $0 |
| 2015 | $1,266 | $24,600 | $24,600 | $0 |
| 2014 | $1,266 | $23,500 | $23,500 | $0 |
| 2013 | -- | $23,600 | $0 | $0 |
Source: Public Records
Map
Nearby Homes
- 1218 Garfield St
- 1116 Hancock St
- 2419 Cherry St
- 2400 Walnut St
- 1202 Palmer Ct
- 909 Elmwood St
- 2400 Stone St Unit 2414
- 2431 Armour St
- 1434 Schumaker St
- 2913 11th Ave
- 1531 Robinson St
- 2927 Cooper Ave
- 1020 Sanborn St
- 3214 Poplar St
- 3321 Stone St
- 3455 Gratiot Ave
- 2835 17th Ave
- 1424 Hazelwood Ln
- 3208 Mount Vernon Rd
- 2812 19th Ave