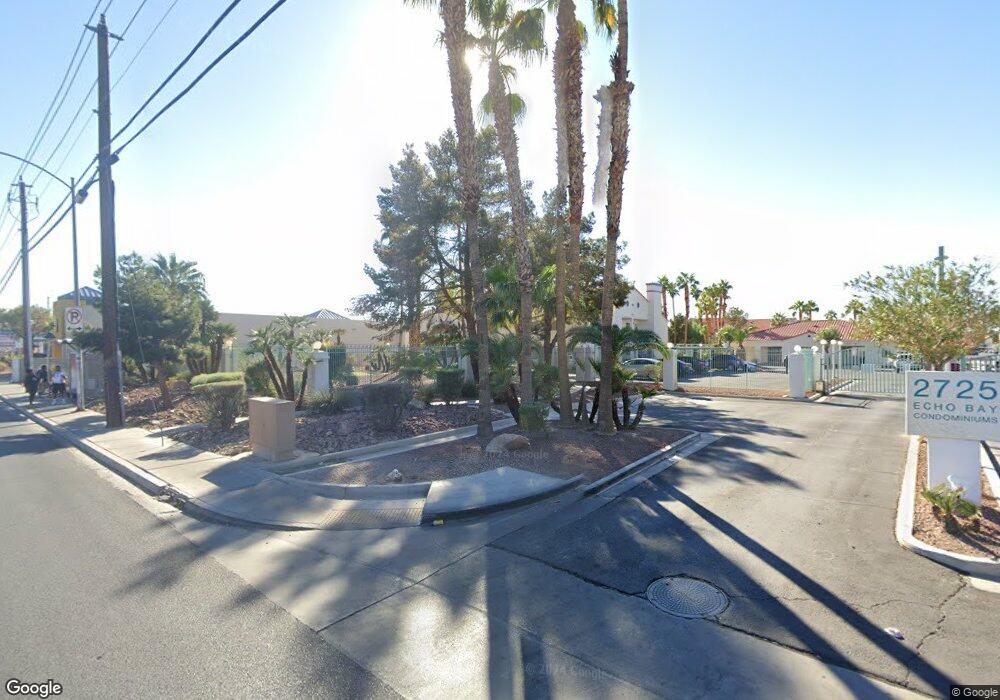
2725 S Nellis Blvd Unit 11 Las Vegas, NV 89121
Estimated Value: $202,000 - $211,000
2
Beds
2
Baths
1,008
Sq Ft
$205/Sq Ft
Est. Value
About This Home
This home is located at 2725 S Nellis Blvd Unit 11, Las Vegas, NV 89121 and is currently estimated at $206,907, approximately $205 per square foot. 2725 S Nellis Blvd Unit 11 is a home located in Clark County with nearby schools including Laura Dearing Elementary School, Jerome Mack Middle School, and Chaparral High School.
Ownership History
Date
Name
Owned For
Owner Type
Purchase Details
Closed on
Jan 6, 2022
Sold by
Smith Lydia Ordiz
Bought by
Javinar Angel and Javinar Marilyn N
Current Estimated Value
Home Financials for this Owner
Home Financials are based on the most recent Mortgage that was taken out on this home.
Original Mortgage
$180,500
Outstanding Balance
$166,375
Interest Rate
3.12%
Mortgage Type
New Conventional
Estimated Equity
$40,532
Purchase Details
Closed on
Jul 12, 2021
Sold by
Smith Lydia Ordiz
Bought by
Smith Lydia Ordiz and Smith Edison Gilbert
Purchase Details
Closed on
Oct 2, 2014
Sold by
Rector Euna L
Bought by
Smith Lydia Ordiz
Purchase Details
Closed on
Jun 14, 2007
Sold by
Rector Euna L
Bought by
Euna L Rector Revocable Trust
Purchase Details
Closed on
Apr 8, 1996
Sold by
Amrine Howard D
Bought by
Rector Euna L
Create a Home Valuation Report for This Property
The Home Valuation Report is an in-depth analysis detailing your home's value as well as a comparison with similar homes in the area
Home Values in the Area
Average Home Value in this Area
Purchase History
| Date | Buyer | Sale Price | Title Company |
|---|---|---|---|
| Javinar Angel | $190,000 | Monument Title Insurance | |
| Smith Lydia Ordiz | -- | None Listed On Document | |
| Smith Lydia Ordiz | $66,900 | Old Republic Title Co | |
| Euna L Rector Revocable Trust | -- | None Available | |
| Rector Euna L | $66,000 | Land Title |
Source: Public Records
Mortgage History
| Date | Status | Borrower | Loan Amount |
|---|---|---|---|
| Open | Javinar Angel | $180,500 |
Source: Public Records
Tax History Compared to Growth
Tax History
| Year | Tax Paid | Tax Assessment Tax Assessment Total Assessment is a certain percentage of the fair market value that is determined by local assessors to be the total taxable value of land and additions on the property. | Land | Improvement |
|---|---|---|---|---|
| 2025 | $448 | $40,199 | $14,000 | $26,199 |
| 2024 | $436 | $40,199 | $14,000 | $26,199 |
| 2023 | $2 | $43,631 | $19,250 | $24,381 |
| 2022 | $423 | $37,342 | $14,700 | $22,642 |
| 2021 | $3 | $36,028 | $14,000 | $22,028 |
| 2020 | $575 | $33,159 | $11,200 | $21,959 |
| 2019 | $2 | $29,585 | $7,700 | $21,885 |
| 2018 | $2 | $24,609 | $4,900 | $19,709 |
| 2017 | $2 | $21,698 | $4,550 | $17,148 |
| 2016 | $2 | $19,548 | $3,850 | $15,698 |
| 2015 | $0 | $14,145 | $2,800 | $11,345 |
| 2014 | $343 | $11,403 | $3,325 | $8,078 |
Source: Public Records
Map
Nearby Homes
- 2725 S Nellis Blvd Unit 2108
- 2725 S Nellis Blvd Unit 2179
- 2725 S Nellis Blvd Unit 2047
- 2725 S Nellis Blvd Unit 1169
- 2725 S Nellis Blvd Unit 2084
- 2725 S Nellis Blvd Unit 2045
- 2725 S Nellis Blvd Unit 1158
- 2725 S Nellis Blvd Unit 2049
- 2725 S Nellis Blvd Unit 2023
- 2725 S Nellis Blvd Unit 1188
- 2725 S Nellis Blvd Unit 1096
- 2725 S Nellis Blvd Unit 2168
- 2725 S Nellis Blvd Unit 2021
- 2725 S Nellis Blvd Unit 2096
- 2685 Bryandouglas Dr
- 4682 Leeann Ln
- 2727 Aarondavid Dr
- 4708 Krissylouise Way
- 2698 Alicialynn Way
- 2969 Juniper Hills Blvd Unit 103
- 2725 S Nellis Blvd Unit 2079
- 2725 S Nellis Blvd Unit 1146
- 2725 S Nellis Blvd Unit 2077
- 2725 S Nellis Blvd Unit 2111
- 2725 S Nellis Blvd Unit 2086
- 2725 S Nellis Blvd Unit 1060
- 2725 S Nellis Blvd Unit 1140
- 2725 S Nellis Blvd Unit 1068
- 2725 S Nellis Blvd Unit 2122
- 2725 S Nellis Blvd Unit 2118
- 2725 S Nellis Blvd Unit 2063
- 2725 S Nellis Blvd Unit 2078
- 2725 S Nellis Blvd Unit 2187
- 2725 S Nellis Blvd Unit 1075
- 2725 S Nellis Blvd Unit 2163
- 2725 S Nellis Blvd Unit 1031
- 2725 S Nellis Blvd Unit 1175
- 2725 S Nellis Blvd Unit 11
- 2725 S Nellis Blvd Unit 1042
- 2725 S Nellis Blvd Unit 1102