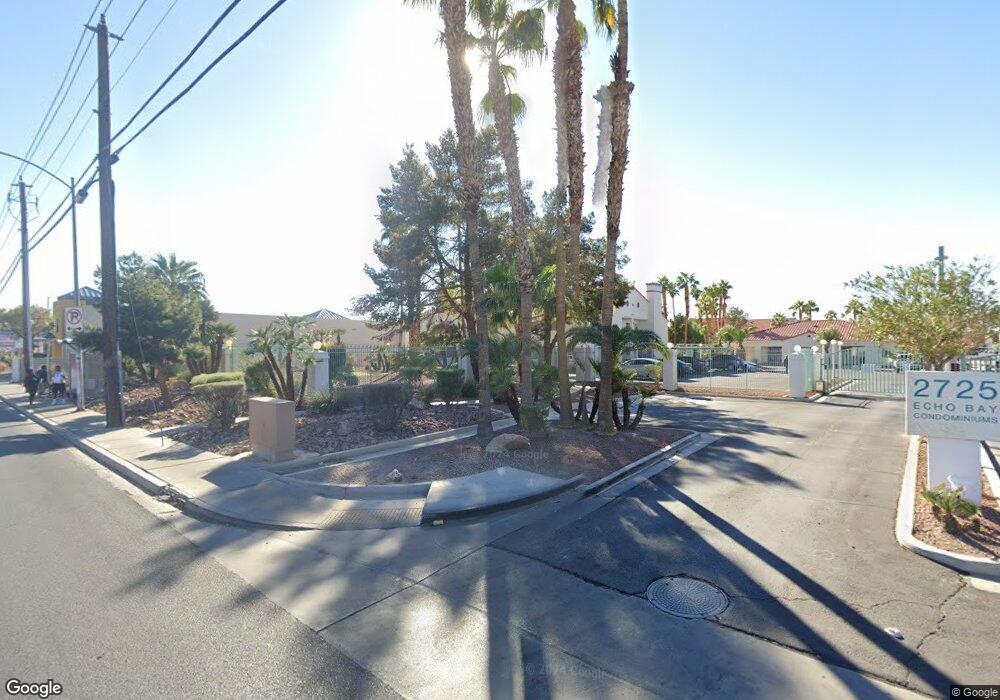
2725 S Nellis Blvd Unit 2079 Las Vegas, NV 89121
Estimated Value: $199,477 - $216,000
2
Beds
2
Baths
1,029
Sq Ft
$202/Sq Ft
Est. Value
About This Home
This home is located at 2725 S Nellis Blvd Unit 2079, Las Vegas, NV 89121 and is currently estimated at $207,869, approximately $202 per square foot. 2725 S Nellis Blvd Unit 2079 is a home located in Clark County with nearby schools including Laura Dearing Elementary School, Jerome Mack Middle School, and Chaparral High School.
Ownership History
Date
Name
Owned For
Owner Type
Purchase Details
Closed on
Mar 18, 2025
Sold by
Richard Garcia Trust and Passos Romildo Dias
Bought by
Marta Hernandez Trust and Hernandez
Current Estimated Value
Purchase Details
Closed on
Jul 13, 2018
Sold by
Garcia Ricardo and Garcia Richard
Bought by
Garcia Richard and Richard Garcia Trust
Purchase Details
Closed on
Nov 15, 2005
Sold by
Lindvall Angie R
Bought by
Garcia Ricardo
Home Financials for this Owner
Home Financials are based on the most recent Mortgage that was taken out on this home.
Original Mortgage
$12,000
Interest Rate
6.35%
Mortgage Type
Fannie Mae Freddie Mac
Purchase Details
Closed on
Aug 3, 1994
Sold by
Heers Charles M
Bought by
Lindvall Martin F and Lindvall Angie R
Home Financials for this Owner
Home Financials are based on the most recent Mortgage that was taken out on this home.
Original Mortgage
$72,666
Interest Rate
8.51%
Mortgage Type
VA
Create a Home Valuation Report for This Property
The Home Valuation Report is an in-depth analysis detailing your home's value as well as a comparison with similar homes in the area
Home Values in the Area
Average Home Value in this Area
Purchase History
| Date | Buyer | Sale Price | Title Company |
|---|---|---|---|
| Marta Hernandez Trust | -- | None Listed On Document | |
| Garcia Richard | -- | None Available | |
| Garcia Ricardo | $162,900 | Nevada Title Company | |
| Lindvall Martin F | $71,000 | Fidelity National Title |
Source: Public Records
Mortgage History
| Date | Status | Borrower | Loan Amount |
|---|---|---|---|
| Previous Owner | Garcia Ricardo | $12,000 | |
| Previous Owner | Garcia Ricardo | $138,165 | |
| Previous Owner | Lindvall Martin F | $72,666 |
Source: Public Records
Tax History Compared to Growth
Tax History
| Year | Tax Paid | Tax Assessment Tax Assessment Total Assessment is a certain percentage of the fair market value that is determined by local assessors to be the total taxable value of land and additions on the property. | Land | Improvement |
|---|---|---|---|---|
| 2025 | $589 | $41,238 | $14,000 | $27,238 |
| 2024 | $546 | $41,238 | $14,000 | $27,238 |
| 2023 | $364 | $44,558 | $19,250 | $25,308 |
| 2022 | $506 | $38,174 | $14,700 | $23,474 |
| 2021 | $469 | $36,830 | $14,000 | $22,830 |
| 2020 | $433 | $33,947 | $11,200 | $22,747 |
| 2019 | $405 | $30,391 | $7,700 | $22,691 |
| 2018 | $387 | $25,322 | $4,900 | $20,422 |
| 2017 | $654 | $22,314 | $4,550 | $17,764 |
| 2016 | $364 | $20,088 | $3,850 | $16,238 |
| 2015 | $361 | $14,528 | $2,800 | $11,728 |
| 2014 | $351 | $11,688 | $3,325 | $8,363 |
Source: Public Records
Map
Nearby Homes
- 2725 S Nellis Blvd Unit 2108
- 2725 S Nellis Blvd Unit 2179
- 2725 S Nellis Blvd Unit 2047
- 2725 S Nellis Blvd Unit 1169
- 2725 S Nellis Blvd Unit 2084
- 2725 S Nellis Blvd Unit 2045
- 2725 S Nellis Blvd Unit 1158
- 2725 S Nellis Blvd Unit 2049
- 2725 S Nellis Blvd Unit 2023
- 2725 S Nellis Blvd Unit 1188
- 2725 S Nellis Blvd Unit 1096
- 2725 S Nellis Blvd Unit 2168
- 2725 S Nellis Blvd Unit 2021
- 2725 S Nellis Blvd Unit 2096
- 2685 Bryandouglas Dr
- 4682 Leeann Ln
- 2727 Aarondavid Dr
- 4708 Krissylouise Way
- 2698 Alicialynn Way
- 2969 Juniper Hills Blvd Unit 103
- 2725 S Nellis Blvd Unit 1146
- 2725 S Nellis Blvd Unit 2077
- 2725 S Nellis Blvd Unit 11
- 2725 S Nellis Blvd Unit 2111
- 2725 S Nellis Blvd Unit 2086
- 2725 S Nellis Blvd Unit 1060
- 2725 S Nellis Blvd Unit 1140
- 2725 S Nellis Blvd Unit 1068
- 2725 S Nellis Blvd Unit 2122
- 2725 S Nellis Blvd Unit 2118
- 2725 S Nellis Blvd Unit 2063
- 2725 S Nellis Blvd Unit 2078
- 2725 S Nellis Blvd Unit 2187
- 2725 S Nellis Blvd Unit 1075
- 2725 S Nellis Blvd Unit 2163
- 2725 S Nellis Blvd Unit 1031
- 2725 S Nellis Blvd Unit 1175
- 2725 S Nellis Blvd Unit 11
- 2725 S Nellis Blvd Unit 1042
- 2725 S Nellis Blvd Unit 1102