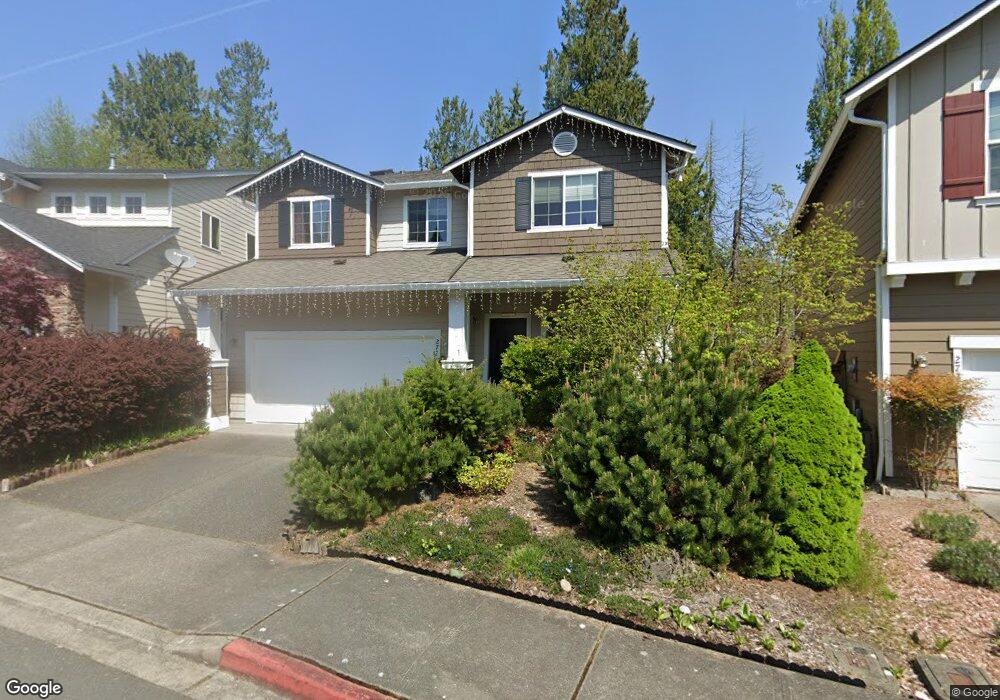
2727 232nd St SE Unit 49 Bothell, WA 98021
Canyon Creek NeighborhoodEstimated Value: $990,000 - $1,140,000
4
Beds
3
Baths
2,287
Sq Ft
$458/Sq Ft
Est. Value
About This Home
This home is located at 2727 232nd St SE Unit 49, Bothell, WA 98021 and is currently estimated at $1,046,454, approximately $457 per square foot. 2727 232nd St SE Unit 49 is a home located in Snohomish County with nearby schools including Maywood Hills Elementary School, Canyon Park Junior High School, and Bothell High School.
Ownership History
Date
Name
Owned For
Owner Type
Purchase Details
Closed on
Jul 24, 2007
Sold by
Howatt James W and Howatt Jane
Bought by
Shah Harshit and Shah Abhilasha
Current Estimated Value
Home Financials for this Owner
Home Financials are based on the most recent Mortgage that was taken out on this home.
Original Mortgage
$408,000
Outstanding Balance
$231,802
Interest Rate
5.25%
Mortgage Type
New Conventional
Estimated Equity
$814,652
Purchase Details
Closed on
Feb 13, 2006
Sold by
Centex Homes
Bought by
Howatt James W and Howatt Jane
Home Financials for this Owner
Home Financials are based on the most recent Mortgage that was taken out on this home.
Original Mortgage
$403,013
Interest Rate
5.87%
Mortgage Type
Fannie Mae Freddie Mac
Create a Home Valuation Report for This Property
The Home Valuation Report is an in-depth analysis detailing your home's value as well as a comparison with similar homes in the area
Home Values in the Area
Average Home Value in this Area
Purchase History
| Date | Buyer | Sale Price | Title Company |
|---|---|---|---|
| Shah Harshit | $510,000 | The Talon Group | |
| Howatt James W | $503,767 | Pnwt |
Source: Public Records
Mortgage History
| Date | Status | Borrower | Loan Amount |
|---|---|---|---|
| Open | Shah Harshit | $408,000 | |
| Previous Owner | Howatt James W | $403,013 |
Source: Public Records
Tax History
| Year | Tax Paid | Tax Assessment Tax Assessment Total Assessment is a certain percentage of the fair market value that is determined by local assessors to be the total taxable value of land and additions on the property. | Land | Improvement |
|---|---|---|---|---|
| 2026 | $7,728 | $996,800 | $660,200 | $336,600 |
| 2025 | $7,217 | $910,600 | $587,100 | $323,500 |
| 2024 | $7,217 | $846,900 | $530,500 | $316,400 |
| 2023 | $8,242 | $1,065,800 | $652,100 | $413,700 |
| 2022 | $6,891 | $716,200 | $365,000 | $351,200 |
| 2020 | $6,654 | $641,600 | $340,000 | $301,600 |
| 2019 | $5,995 | $598,600 | $300,000 | $298,600 |
| 2018 | $5,510 | $529,500 | $260,000 | $269,500 |
| 2017 | $4,614 | $446,800 | $195,000 | $251,800 |
| 2016 | $4,490 | $450,600 | $178,000 | $272,600 |
| 2015 | $4,384 | $417,200 | $155,000 | $262,200 |
| 2013 | $3,488 | $299,700 | $120,000 | $179,700 |
Source: Public Records
Map
Nearby Homes
- 23210 27th Ave SE Unit 1
- 23502 25th Dr SE
- 23724 35th Dr SE Unit 44
- 23730 35th Dr SE Unit 43
- 3333 228th St SE Unit 69
- 3333 228th St SE Unit 99
- 3333 228th St SE Unit 94
- 3333 228th St SE Unit 49
- 3333 228th St SE Unit 23
- 23731 35th Dr SE Unit 38
- 2403 238th Place SE
- 3520 237th St SE Unit 45
- 23947 36th Ave SE Unit 20
- 3515 237th St SE Unit 28
- 3611 232nd St SE
- 3509 237th St SE Unit 27
- 3508 237th St SE Unit 47
- 3516 237th St SE Unit 46
- 0 239th St SE
- 23736 35th Dr SE
- 2731 232nd St SE
- 2723 232nd St SE
- 2735 232nd St SE Unit 47
- 2719 232nd St SE Unit 51
- 2720 232nd St SE Unit 44
- 2730 232nd St SE
- 2805 232nd St SE Unit 46
- 2716 232nd St SE
- 2716 232nd St SE Unit 43
- 2715 232nd St SE Unit 52
- 2713 232nd Place SE
- 2712 232nd St SE Unit 42
- 2809 232nd St SE Unit 45
- 2711 232nd St SE Unit 53
- 2711 232nd St SE
- 2709 232nd Place SE Unit 38
- 2726 232nd Place SE Unit 31
- 2804 232nd St SE Unit 32
- 2708 232nd St SE Unit 41
- 2808 232nd St SE
Your Personal Tour Guide
Ask me questions while you tour the home.