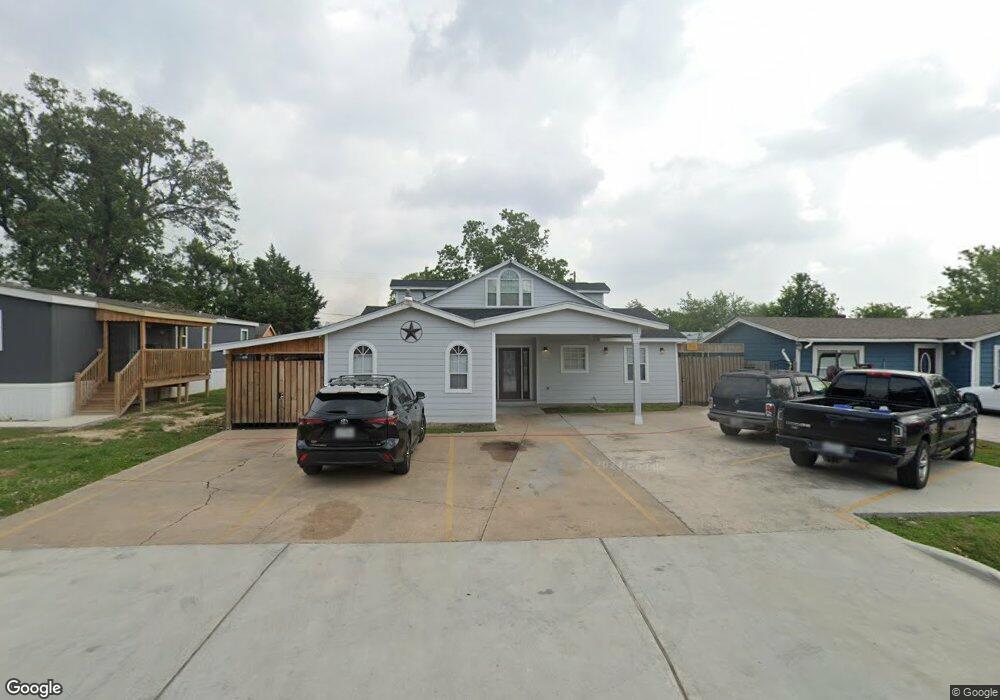
2727 Brea Crest St Houston, TX 77093
East Aldine NeighborhoodEstimated Value: $251,000 - $317,000
3
Beds
2
Baths
2,000
Sq Ft
$140/Sq Ft
Est. Value
About This Home
This home is located at 2727 Brea Crest St, Houston, TX 77093 and is currently estimated at $279,682, approximately $139 per square foot. 2727 Brea Crest St is a home located in Harris County with nearby schools including Vardeman EC/PK/K, Worsham Elementary School, and Macarthur Ninth Grade School.
Ownership History
Date
Name
Owned For
Owner Type
Purchase Details
Closed on
Oct 31, 2023
Sold by
Flores Enrique Isasis and Flores Maria Victoria
Bought by
Isasis Flores Enrique and Isasis Victoria Flores
Current Estimated Value
Purchase Details
Closed on
Aug 8, 2023
Sold by
Luccammi Rental Properties Llc
Bought by
Isasis Flores Enrique and Isasis Victoria Flores
Purchase Details
Closed on
Dec 16, 2022
Sold by
Flores Enrique Isaias and Flores Maria Victoria
Bought by
Lucammi Rental Properties Llc
Purchase Details
Closed on
Oct 5, 2022
Sold by
Flores Nahum E
Bought by
Flores Enrique Isaias and Flores Maria
Home Financials for this Owner
Home Financials are based on the most recent Mortgage that was taken out on this home.
Original Mortgage
$256,500
Interest Rate
5.55%
Mortgage Type
New Conventional
Purchase Details
Closed on
May 27, 2003
Sold by
Flores Luis and Flores Oziel
Bought by
Flores Nahum E and Flores Exiquia B
Create a Home Valuation Report for This Property
The Home Valuation Report is an in-depth analysis detailing your home's value as well as a comparison with similar homes in the area
Home Values in the Area
Average Home Value in this Area
Purchase History
| Date | Buyer | Sale Price | Title Company |
|---|---|---|---|
| Isasis Flores Enrique | -- | None Listed On Document | |
| Isasis Flores Enrique | -- | None Listed On Document | |
| Lucammi Rental Properties Llc | -- | -- | |
| Flores Enrique Isaias | -- | Chicago Title Company | |
| Flores Enrique Isaias | -- | -- | |
| Flores Nahum E | -- | -- |
Source: Public Records
Mortgage History
| Date | Status | Borrower | Loan Amount |
|---|---|---|---|
| Previous Owner | Flores Enrique Isaias | $256,500 |
Source: Public Records
Tax History Compared to Growth
Tax History
| Year | Tax Paid | Tax Assessment Tax Assessment Total Assessment is a certain percentage of the fair market value that is determined by local assessors to be the total taxable value of land and additions on the property. | Land | Improvement |
|---|---|---|---|---|
| 2025 | $5,907 | $299,528 | $44,788 | $254,740 |
| 2024 | $5,907 | $305,299 | $44,788 | $260,511 |
| 2023 | $5,907 | $340,728 | $31,320 | $309,408 |
| 2022 | $4,124 | $225,000 | $31,320 | $193,680 |
| 2021 | $3,930 | $203,055 | $31,320 | $171,735 |
| 2020 | $3,766 | $187,989 | $31,320 | $156,669 |
| 2019 | $3,585 | $170,167 | $31,320 | $138,847 |
| 2018 | $0 | $137,000 | $15,034 | $121,966 |
| 2017 | $9,315 | $137,000 | $15,034 | $121,966 |
| 2016 | $2,879 | $151,480 | $15,034 | $136,446 |
| 2015 | $1,003 | $145,905 | $15,034 | $130,871 |
| 2014 | $1,003 | $112,649 | $15,034 | $97,615 |
Source: Public Records
Map
Nearby Homes
- 2915 Brea Crest St
- 11716 Innsbury Dr
- 2723 Castledale Dr
- 2817 Cromwell St
- 3111 Hartwick Rd
- 11746 Somerset Ln
- 2922 Bertrand St
- 3214 Brea Crest St
- 2930 Bertrand St
- 2326 Sunny Dr
- 2410 Mierianne St
- 2311 Warwick Rd
- 2306 Wardmont St
- 2629 Kowis St
- 2237 Cromwell St
- 3418 Hopper Rd
- 2636 Lone Oak Rd
- 2131 Cromwell St Unit D
- 2152 William Tell St
- 2131 Warwick Rd
- 2723 Brea Crest St
- 2731 Brea Crest St
- 11711 Shady Ln
- 2719 Brea Crest St
- 2715 Brea Crest St
- 2730 Brea Crest St
- 2718 Brea Crest St
- 2711 Brea Crest St
- 2714 Brea Crest St
- 2635 Mooney Rd
- 2710 Brea Crest St
- 2631 Mooney Rd
- 2707 Brea Crest St
- 2627 Mooney Rd
- 2706 Brea Crest St
- 2802 Brea Crest St
- 2623 Mooney Rd
- 2703 Brea Crest St
- 2702 Brea Crest St
- 2619 Mooney Rd