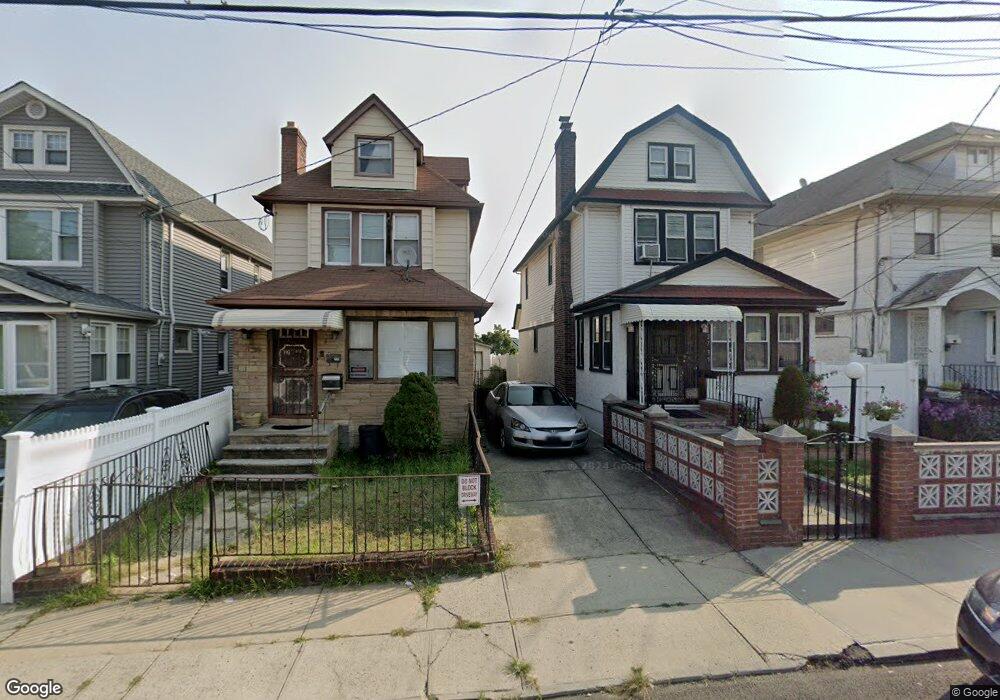
2727 Curtis St East Elmhurst, NY 11369
East Elmhurst NeighborhoodEstimated Value: $806,000 - $996,000
--
Bed
--
Bath
1,880
Sq Ft
$484/Sq Ft
Est. Value
About This Home
This home is located at 2727 Curtis St, East Elmhurst, NY 11369 and is currently estimated at $909,641, approximately $483 per square foot. 2727 Curtis St is a home located in Queens County with nearby schools including P.S. 127 Aerospace Science Magnet School, Jhs 185 Edward Bleeker, and Flushing High School.
Ownership History
Date
Name
Owned For
Owner Type
Purchase Details
Closed on
Jul 6, 2007
Sold by
Vitacco Jr Esq Referee Guy R
Bought by
Residential Funding Company Llc
Current Estimated Value
Purchase Details
Closed on
Oct 26, 2005
Sold by
Colon Susana E and Loyola Daniel R
Bought by
Villagra Marisol
Home Financials for this Owner
Home Financials are based on the most recent Mortgage that was taken out on this home.
Original Mortgage
$479,120
Interest Rate
5.93%
Mortgage Type
Purchase Money Mortgage
Purchase Details
Closed on
Sep 29, 1997
Sold by
Tonge Kenneth and Tonge Karen
Bought by
Colon Susana E and Loyola Daniel R
Home Financials for this Owner
Home Financials are based on the most recent Mortgage that was taken out on this home.
Original Mortgage
$155,400
Interest Rate
7.23%
Mortgage Type
FHA
Create a Home Valuation Report for This Property
The Home Valuation Report is an in-depth analysis detailing your home's value as well as a comparison with similar homes in the area
Home Values in the Area
Average Home Value in this Area
Purchase History
| Date | Buyer | Sale Price | Title Company |
|---|---|---|---|
| Residential Funding Company Llc | $512,906 | -- | |
| Residential Funding Company Llc | $512,906 | -- | |
| Villagra Marisol | $598,900 | -- | |
| Villagra Marisol | $598,900 | -- | |
| Colon Susana E | $155,000 | Commonwealth Land Title Ins | |
| Colon Susana E | $155,000 | Commonwealth Land Title Ins |
Source: Public Records
Mortgage History
| Date | Status | Borrower | Loan Amount |
|---|---|---|---|
| Previous Owner | Villagra Marisol | $119,780 | |
| Previous Owner | Villagra Marisol | $479,120 | |
| Previous Owner | Colon Susana E | $155,400 |
Source: Public Records
Tax History Compared to Growth
Tax History
| Year | Tax Paid | Tax Assessment Tax Assessment Total Assessment is a certain percentage of the fair market value that is determined by local assessors to be the total taxable value of land and additions on the property. | Land | Improvement |
|---|---|---|---|---|
| 2025 | $6,454 | $35,506 | $6,850 | $28,656 |
| 2024 | $6,466 | $33,534 | $7,477 | $26,057 |
| 2023 | $6,109 | $31,814 | $6,023 | $25,791 |
| 2022 | $5,721 | $55,560 | $12,120 | $43,440 |
| 2021 | $5,932 | $59,400 | $12,120 | $47,280 |
| 2020 | $5,967 | $51,900 | $12,120 | $39,780 |
| 2019 | $5,553 | $49,560 | $12,120 | $37,440 |
| 2018 | $5,107 | $26,512 | $6,901 | $19,611 |
| 2017 | $4,813 | $25,081 | $7,758 | $17,323 |
| 2016 | $4,620 | $25,081 | $7,758 | $17,323 |
| 2015 | $2,854 | $24,657 | $9,916 | $14,741 |
| 2014 | $2,854 | $23,288 | $11,242 | $12,046 |
Source: Public Records
Map
Nearby Homes
- 2734 Butler St
- 29-15 Gillmore St
- 2516 Curtis St
- 10660 Ditmars Blvd
- 29-04 Humphreys St
- 27-32 Mcintosh St
- 2716 Mcintosh St
- 104-47 Ditmars Blvd
- 10443 Ditmars Blvd
- 2556 100th St
- 31-14 102nd St
- 24-24 Gillmore St
- 3123 102nd St
- 100-22 31st Ave
- 31-15 101st St
- 2561 99th St
- 2572 99th St
- 97-09 24th Ave
- 3258 105th St Unit 6B
- 3258 105th St Unit 4A
- 2725 Curtis St
- 2733 Curtis St
- 2733 Curtis St
- 2723 Curtis St
- 2735 Curtis St
- 2735 Curtis St
- 2721 Curtis St
- 27-37 Curtis St
- 2737 Curtis St
- 27-30 Butler St
- 2730 Butler St
- 2734 Butler St
- 2719 Curtis St
- 27-34 Butler St
- 2726 Butler St
- 27-26 Butler St Unit 2
- 2736 Butler St
- 2741 Curtis St
- 2736 Butler St
- 2720 Butler St